
VWAP Volume Weighted Average Price
Chỉ báo
Phiên bản 1.0, Oct 2025
Windows, Mac
4.6
Đánh giá: 3
Mô tả
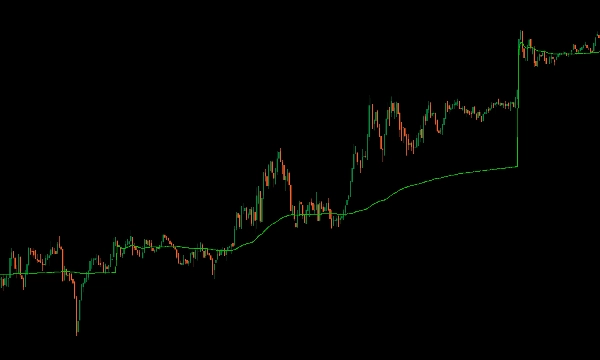
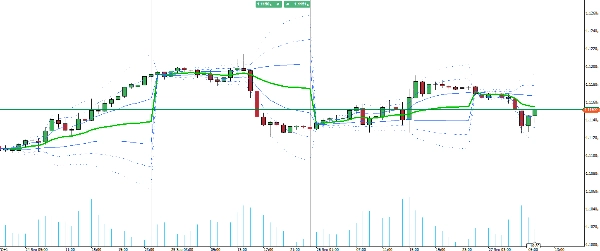
Giới thiệu chỉ báo VWAP cho cTrader, mang đầy đủ chức năng của Giá Trung Bình Trọng Số Khối Lượng của TradingView đến nền tảng giao dịch của bạn.
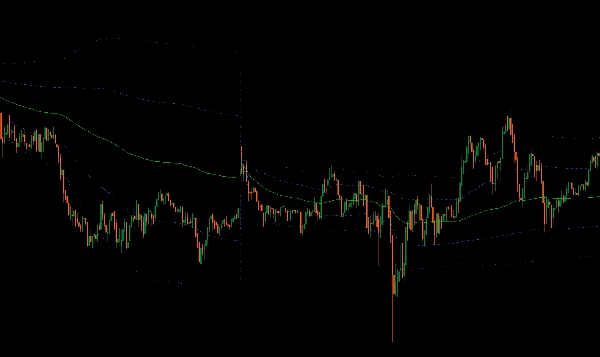
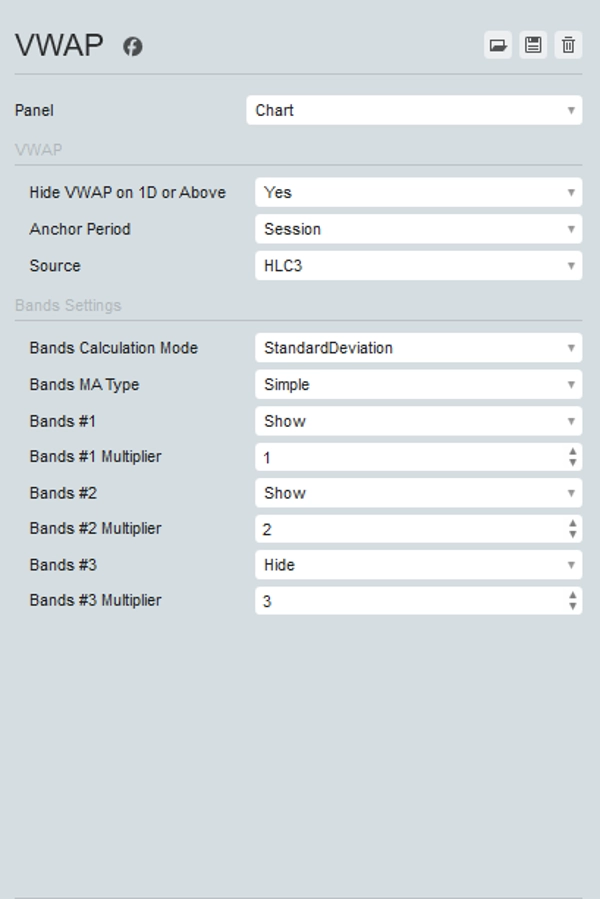
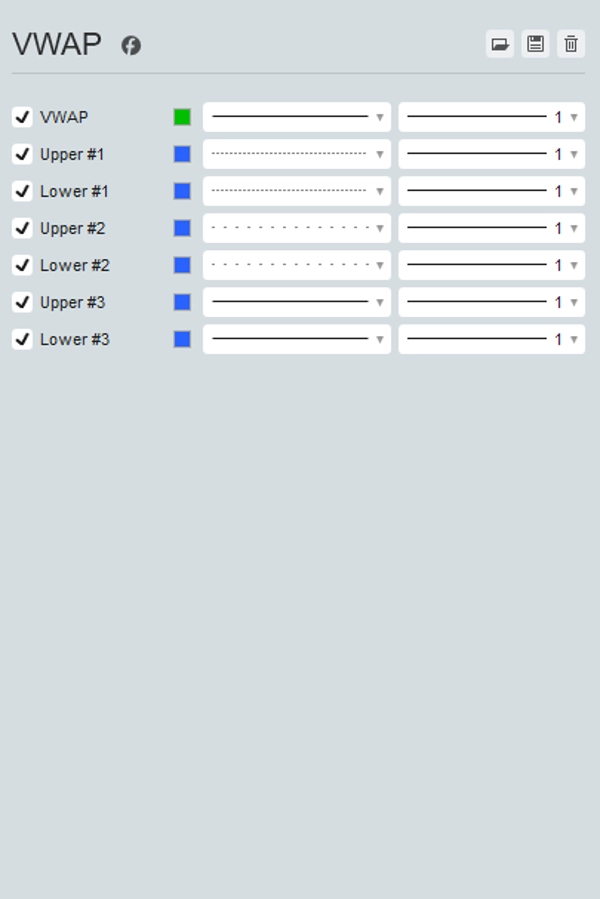
Công cụ toàn diện này cho phép bạn chọn khoảng thời gian neo (Phiên, Tuần, Tháng, Quý, Năm) và lựa chọn từ nhiều nguồn giá khác nhau, bao gồm Mở, Cao, Thấp, Đóng, HL2, HLC3, OHLC4, và HLCC4. Ngoài ra, nó có thể hiển thị lên đến ba dải lệch chuẩn trên và dưới, cung cấp cái nhìn toàn diện về phân phối giá.
Chỉ báo VWAP cập nhật theo thời gian thực với dữ liệu tick, đảm bảo bạn có những thông tin chính xác và kịp thời nhất cho các quyết định giao dịch của mình. Nâng cao chiến lược giao dịch của bạn với chỉ báo VWAP đa năng và mạnh mẽ trên cTrader.
Tóm tắt
Tóm tắt AI
The VWAP (Volume Weighted Average Price) indicator for cTrader replicates the full functionality of TradingView's VWAP tool. It allows traders to select anchor periods including Session, Week, Month, Quarter, and Year, and choose from multiple price sources such as Open, High, Low, Close, HL2, HLC3, OHLC4, and HLCC4. The indicator also supports displaying up to three standard deviation bands above and below the VWAP line, providing insights into price distribution and volatility. It updates in real time with tick data, ensuring timely and accurate information for trading decisions. This indicator is applicable across various markets including Forex, Crypto, Stocks, Commodities, and Indices, and supports symbols like BTCUSD, EURUSD, GBPUSD, XAUUSD, NAS100, and USDJPY. It is suitable for strategies involving breakout and scalping techniques.
Hồ sơ chỉ báo
Đánh giá của khách hàng
4.6
Đánh giá: 3
5 | 67 % | |
4 | 33 % | |
3 | 0 % | |
2 | 0 % | |
1 | 0 % |
Đánh giá của khách hàng
October 27, 2025
Solid enough as a backup opinion. Win rate means less without average R.
October 22, 2025
it earns a spot because the trade idea gets a pause before execution. A clean signal can still fail.
October 19, 2025
The idea is fine, just do not expect it to print perfect entries, and The result needs a journal.
Thảo luận
Câu hỏi thường gặp
BTCUSD
Forex
Breakout
Indices
EURUSD
Commodities
GBPUSD
NZDUSD
Prop
Scalping
Crypto
Stocks
XAUUSD
NAS100
USDJPY
VWAP
Các sản phẩm có sẵn trên cTrader Store, bao gồm bot giao dịch, chỉ báo và plugin, được cung cấp bởi các nhà phát triển bên thứ ba và chỉ nhằm mục đích cung cấp thông tin và tiếp cận kỹ thuật. cTrader Store không phải là nhà môi giới và không cung cấp lời khuyên đầu tư, khuyến nghị cá nhân hay bất kỳ đảm bảo nào về hiệu suất trong tương lai.


Giá
Kể từ 25/09/2025
25
Lượt bán
331
Cài đặt miễn phí