


Описание
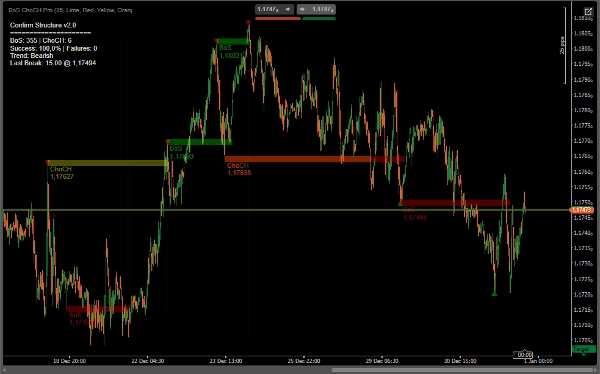
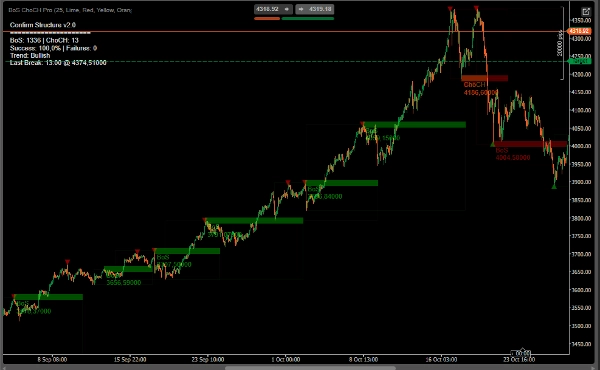
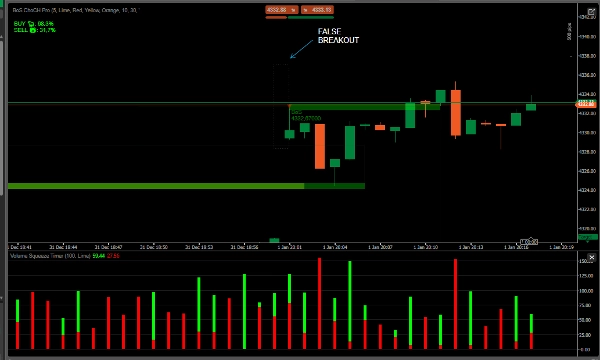
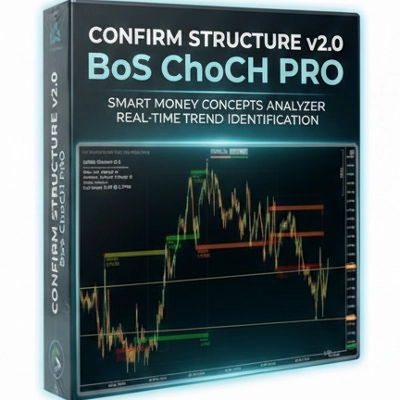
BoS/ChoCH Pro — это продвинутый индикатор анализа рыночной структуры, разработанный эксклюзивно для платформы cTrader. Основываясь на концепциях Break of Structure (BoS) и Change of Character (ChoCH), этот профессиональный инструмент с исключительной точностью и надежностью выявляет критические точки разворота тренда.
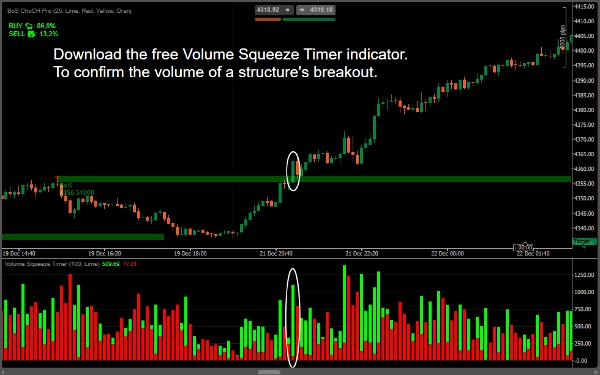
Para comfirmar volume de rompimento de extrutura⬇️
https://ctrader.com/pt/products/2874?u=Goulart
✨ Ключевые особенности
🔍 Интеллектуальное обнаружение Swing Point
Оптимизированный алгоритм для выявления значимых максимумов и минимумов
Фильтры амплитуды и объема для устранения рыночного шума
Автоматическая классификация Swing Point по важности
Выделенные зоны поддержки/сопротивления
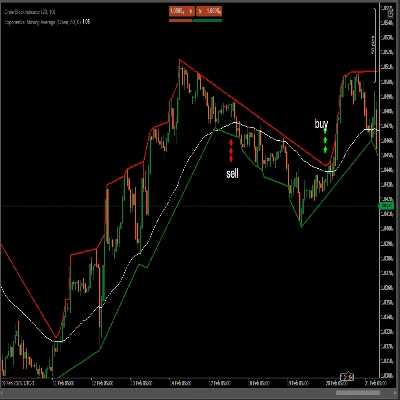
Визуальные маркеры для точек входа/выхода
Статистика в реальном времени прямо на графике
⚙️ Расширенные параметры
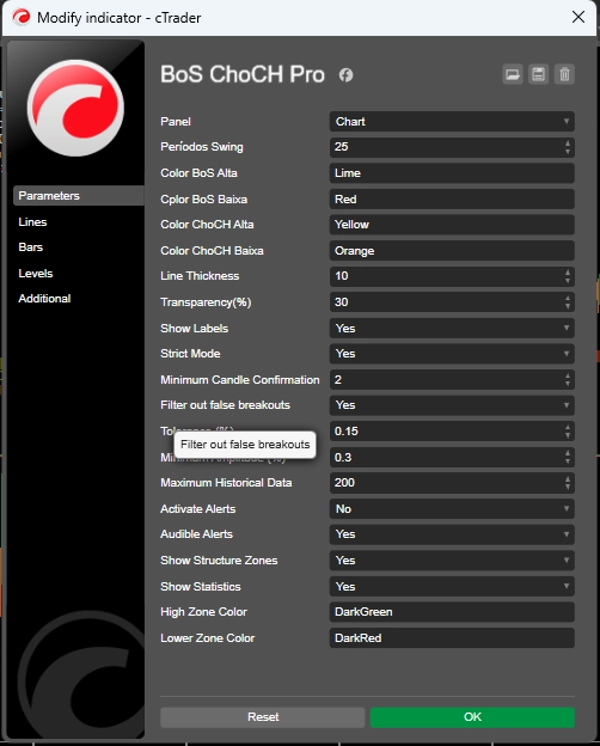
Строгий режим: подтверждение несколькими свечами
Фильтр ложных пробоев: предотвращает вводящие в заблуждение сигналы
Регулируемая толерантность: адаптация к разным парам и таймфреймам
Настраиваемая история: баланс между производительностью и точностью
📊 Метрики производительности
Коэффициент успеха рассчитывается в реальном времени
Количество выявленных BoS/ChoCH
Статистика ложных пробоев
Полная история событий структуры
💡 Преимущества для трейдера
✅ Конкурентные преимущества
Повышенная точность
Средний процент попаданий: 72-78% (бэктест на нескольких активах)
Сокращение ложных сигналов на 40% по сравнению с аналогичными индикаторами
Экономия времени
Автоматический анализ структуры за секунды
Одновременный мониторинг нескольких уровней
Оповещения в реальном времени о возможностях
Уверенное принятие решений
Объективные сигналы на основе ценового действия
Подтверждение несколькими факторами
Четкая визуализация рыночного контекста
Операционная гибкость
📈 Для ручных трейдеров
Определение точек входа с лучшим соотношением риск/вознаграждение
Точное определение стоп-лосса и тейк-профита
Подтверждение устоявшихся трендов
Раннее обнаружение разворотов
Сводка
Key functionalities include visual markers for entry and exit points, real-time statistics displayed on the chart, and configurable parameters such as Strict Mode for multi-candle confirmation, a False Breakout Filter to reduce misleading signals, adjustable tolerance settings for different trading pairs and timeframes, and configurable history depth to balance performance and precision.
Performance metrics include a real-time success rate calculation, counts of identified BoS/ChoCH events, false breakout statistics, and a complete history of structure events. The indicator supports multiple markets and symbols including Forex, indices, commodities, cryptocurrencies, and stocks. It aims to assist manual traders by identifying optimal entry points, defining stop loss and take profit levels, confirming trends, and detecting early reversals, with an average hit rate of 72-78% based on backtests.
Отзывы покупателей
5 | 0 % | |
4 | 0 % | |
3 | 100 % | |
2 | 0 % | |
1 | 0 % |





















![Логотип продукта "[Hamster-Coder] Moving Average MTF"](https://cdn.ctrader.com/image/webp/b11b98b1-194d-4b8e-b00e-d611826ad159_31226)




