
PVA Volume+Analysis_noSourceCode
지표
462 다운로드
버전 1.0, Mar 2025
Windows, Mac
5.0
리뷰: 3
설명
PVA(가격-거래량 분석)는 금융 자산의 가격과 거래량 간의 관계를 연구하는 기술적 분석 방법입니다. PVA의 핵심 아이디어는 거래량이 추세의 강도와 방향에 대한 중요한 정보를 제공할 수 있어, 트레이더가 더 정보에 기반한 결정을 내리는 데 도움을 준다는 것입니다.
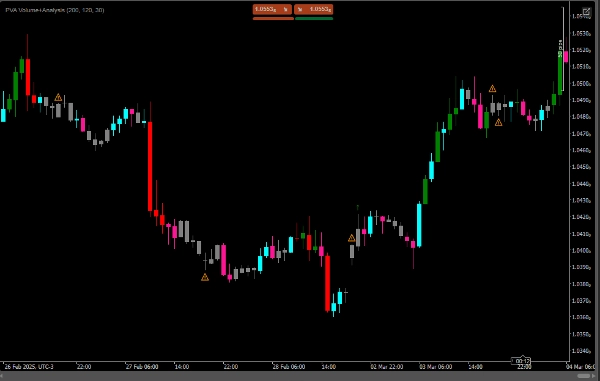
-가격 상승과 함께 거래량 증가: 강한 상승 추세를 나타내며, 녹색 기호(상향 화살표)가 표시됩니다.
-가격 하락과 함께 거래량 증가: 강한 하락 추세를 나타내며, 빨간색 기호(하향 화살표)가 표시됩니다.
-가격 상승과 함께 거래량 감소: 상승 추세가 약해질 수 있음을 나타내며, 주황색 경고(경고 기호)가 표시됩니다.
-가격 하락과 함께 거래량 감소: 하락 추세가 약해질 수 있음을 나타내며, 주황색 경고(경고 기호)도 표시됩니다.
-상승 또는 하락 움직임에서 거래량이 감소하면, 경고 표시(⚠️)가 그려집니다.
요약
AI 요약
PVA Volume+Analysis is a technical indicator based on Price-Volume Analysis (PVA), which examines the relationship between price movements and trading volume to assess trend strength and direction. The indicator provides visual signals to help interpret market trends:
- A green up arrow appears when volume increases alongside rising prices, indicating a strong uptrend.
- A red down arrow signals a strong downtrend when volume increases as prices fall.
- An orange warning symbol alerts when volume decreases during rising or falling prices, suggesting the current trend may be weakening.
- A general alert mark (⚠️) is displayed if volume declines during either upward or downward price movements.
This indicator assists traders by highlighting the interplay between price and volume, offering insights into the momentum behind market trends. It is designed for use in technical analysis to support more informed trading decisions.
지표 프로필
고객 리뷰
5.0
리뷰: 3
5 | 100 % | |
4 | 0 % | |
3 | 0 % | |
2 | 0 % | |
1 | 0 % |
고객 리뷰
January 28, 2026
August 12, 2025
Pros: Detailed price-volume analysis, highlights high-activity zones, useful for VSA trading. Cons: No alerts, no MTF mode, can be resource-heavy with large history. Requires experience to interpret.
May 13, 2025
상담
자주 묻는 질문(FAQ)
트레이딩 봇, 지표, 플러그인 등 cTrader Store에서 제공되는 상품은 제3자 개발자에 의해 제공되며, 이는 단순히 정보 및 기술적 접근을 목적으로 제공된 것입니다. cTrader Store는 중개인이 아니며, 투자 조언, 개인별 추천 또는 향후 성과에 대한 어떠한 보장도 제공하지 않습니다.


!["[Hamster-Coder] Bollinger Bands" 로고](https://cdn.ctrader.com/image/webp/21d8e5d6-fb11-4bac-b9ee-cd05c2b76804_30327)


가격
117
판매
9.83K
무료 설치