설명
주요 목표:
가격 수준별 거래량 분포를 매핑하여 다음을 식별:
높은 유동성 영역
낮은 유동성 영역
매수자와 매도자 간의 불균형
이 지표는 시장 구조를 이해하고 거래에 높은 확률 영역을 식별하는 데 강력합니다! 🎯
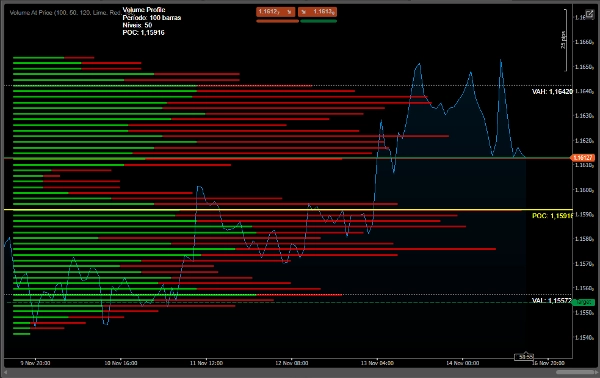
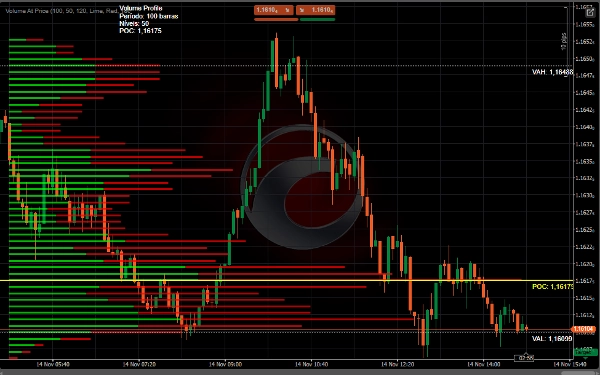
1. POC (Point of Control)
Linha Amarela - 가장 많이 거래된 가격
가장 큰 유동성과 가격 영역
자연스러운 지지/저항
2. 가치 영역
하얀 선들 - 거래량의 70%가 거래된 영역
VAH (Value Area High) - 상한선
VAL (Value Area Low) - 하한선
시장 균형 구역
3. 거래량 핵심
🟢 초록 - 우세한 매수 거래량
🔴 빨강 - 우세한 매도 거래량
바 길이 = 거래량 강도
📊 전략 사용
1. 지지 및 저항 식별
• POC는 동적 지지/저항 역할을 합니다
• 가치 영역은 균형 구역을 정의합니다
• 중요한 S/R 프로필 경계
2. 돌파 분석
• VAH 위 돌파 → 강한 상승 추세
• VAL 아래 돌파 → 하락 추세
• 돌파 실패 거래량은 움직임을 확인합니다
3. 진입 지점
• 매수: 매수 거래량과 함께 VAL 재시험
• 매도: 매도 거래량과 함께 VAH 재시험
• 페이드: 프로필 극단에 반대 방향으로 거래
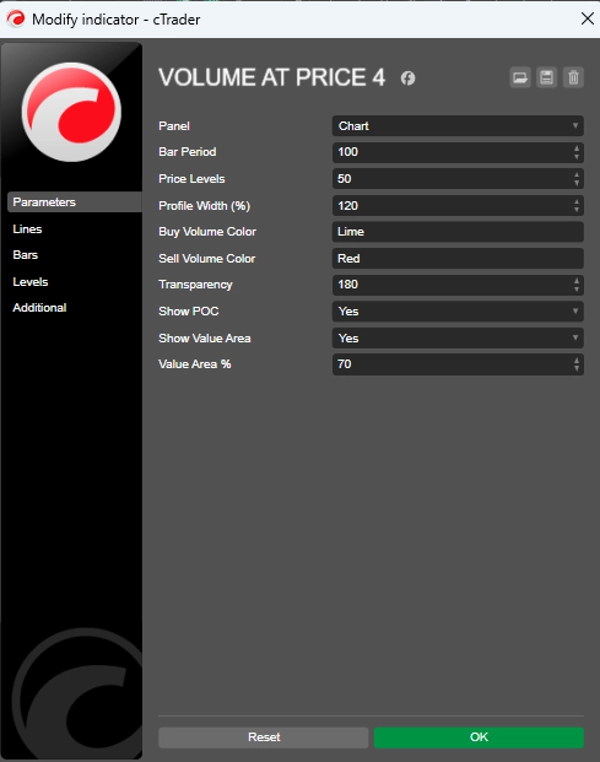
⚙️ 권장 설정
데이 트레이딩용
csharp
기간 = 50-100
가격 수준 = 50
프로필 너비 = 120%
가치 영역 % = 70
스윙 트레이딩용
csharp
기간 = 100-200
가격 수준 = 80
프로필 너비 = 150%
가치 영역 % = 70
✅ 장점:
동적 지지/저항을 식별
시장 의도(거래량)를 보여줌
중요한 유동성 영역을 드러냄
불균형을 명확하게 시각화
현재 거래량 틱 수
요약
- Point of Control (POC): The price level with the highest traded volume, acting as a dynamic support or resistance.
- Value Area: The price range where 70% of volume is traded, defined by Value Area High (VAH) and Value Area Low (VAL), representing market balance zones.
- Volume Cores: Colored bars indicating dominant buying (green) or selling (red) volume, with bar length reflecting volume intensity.
The indicator supports strategies like identifying support and resistance levels, breakout analysis (trend direction based on VAH and VAL breaks), and entry points (buy near VAL with buyer volume, sell near VAH with seller volume, or fade at profile extremes).
Recommended settings vary by trading style: for day trading, shorter periods and narrower profiles; for swing trading, longer periods and wider profiles. This tool aids in visualizing liquidity, market intent, and volume imbalances to inform trading decisions.
고객 리뷰
5 | 0 % | |
4 | 50 % | |
3 | 50 % | |
2 | 0 % | |
1 | 0 % |