설명
TrendFallowing: cTrader 플랫폼을 위한 고급 기술 지표로, 여러 분석 방식을 하나의 솔루션으로 결합합니다. 지표 수렴을 통한 추세 확인을 원하는 트레이더를 위해 개발되었으며, 정확한 신호와 검증 필터를 통해 완전한 시장 관점을 제공합니다.
운영 전략에 관한 소개 영상을 시청하세요!
🎯 사용 전략
1. 추세 추종 거래
적용: 확립된 추세 식별 및 추종
시간 프레임: 장기 포지션을 위한 H4, D1
설정: ADX > 25, 평균 이상의 거래량
위험 관리: 50기간 이동평균선 아래에 손절매 설정
2. 스윙 트레이딩
적용: 중기 움직임 포착
시간 프레임: H1, H4
설정: 거래량 필터 활성화, 거래량 프로파일로 확인
목표: 거래량 프로파일 POC를 이익 실현 지점으로 설정
3. 돌파 거래
적용: 지지/저항 돌파 시 진입
설정: PVA 거래량으로 움직임 강도 확인
확인: ADX 상승 + 평균 이상의 거래량
4. 스캘핑 (더 짧은 시간 프레임)
적용: 다중 확인을 통한 빠른 거래
시간 프레임: M1, M5
설정: 엄격한 거래량 필터 및 모멘텀
🔧 지표 작동 방식
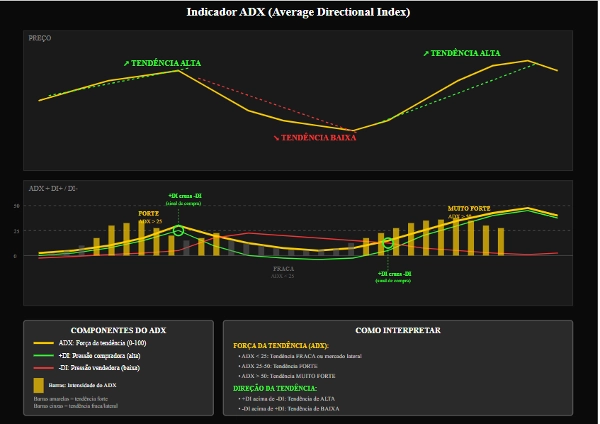
핵심 ADX & DI
ADX (평균 방향 지수)
기능: 추세 강도 측정
해석:
0-25: 약한 추세/횡보
25-50: 강한 추세
50 이상: 매우 강한 추세
실용적 사용: ADX < 20일 때 거래 회피
+DI / -DI (방향성 지표)
+DI: 매수 세력
-DI: 매도 세력
신호: +DI가 -DI를 상향 돌파할 때(매수) 및 그 반대
ADX 기울기 (ADX Slope)
기능: 추세 가속도 측정
그래프: 청록색 히스토그램
신호: 양수 값은 추세 강화 표시
거래량 필터
거래량 MA 필터
기능: 평균 이상의 거래량으로 신호 검증
매개변수: 기간 20, 배수 1.0
사용: 기관 투자자 관심 확인
PVA 거래량 (가격 거래량 분석)
색상 및 의미:
녹색: 매우 높은 거래량으로 매수 (>150% 평균)
파란색: 높은 거래량으로 매수
빨간색: 매우 높은 거래량으로 매도
분홍색: 높은 거래량으로 매도
노란색: 핀 바/지지선 돌파 시 소진
거래량 프로파일
POC (통제점)
기능: 가장 많이 거래된 가격
사용: 거래의 자연스러운 목표, 동적 지지/저항
가치 영역
기능: 거래량의 70%가 이루어진 구역
해석:
가격 위: 상승 추세
가격 아래: 하락 추세
내부: 횡보 가능성
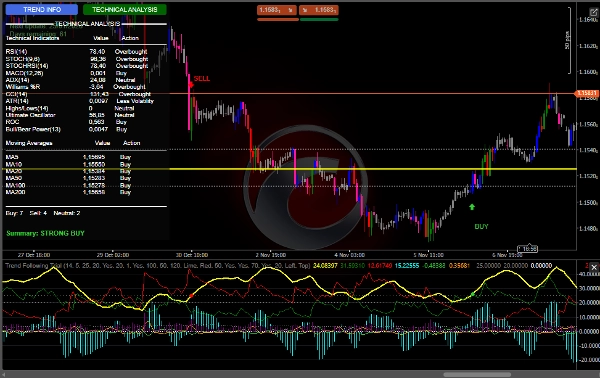
지표 패널
RSI: 과매도 (<30) / 과매수 (>70)
MACD: 모멘텀
Williams %R: 극한 상태
CCI: 반전 식별
스토캐스틱: 단기 모멘텀
얼티밋 오실레이터: 다중 시간 프레임 모멘텀
이동평균선
전체 MA 세트 (5, 10, 20, 50, 100, 200)
추세 정렬 분석
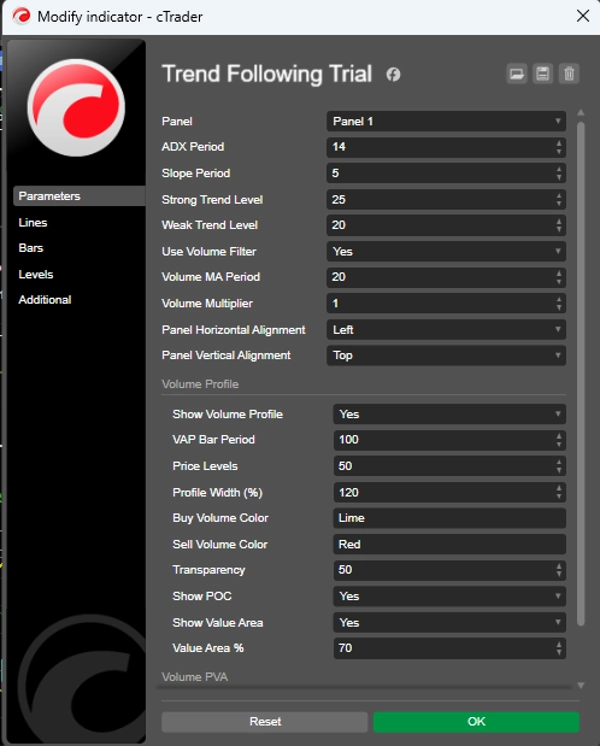
⚙️ 권장 설정
보수적 설정
ADX 기간: 14
기울기 기간: 5
강한 추세 수준: 25
약한 추세 수준: 20
거래량 필터 사용: true
거래량 MA 기간: 20
거래량 배수: 1.2
공격적 설정
ADX 기간: 10
기울기 기간: 3
강한 추세 수준: 20
약한 추세 수준: 15
거래량 필터 사용: true
MA 거래량 기간: 14
거래량 배수: 1.0
거래량 프로파일 (권장)
거래량 프로파일 표시: true
VAP 바 기간: 100
가격 수준: 50
가치 영역 %: 70
POC 표시: true
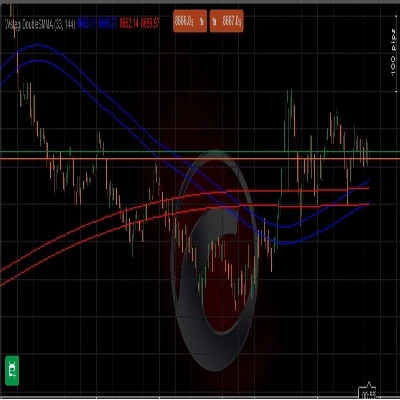
🎨 시각 자료
사용자 인터페이스
동적 패널: 실시간 정보
인터랙티브 버튼: 분석 간 전환
직관적인 색상: 기능 기반 코딩
그래픽 신호
화살표: 매수/매도 진입
소리: 청각 알림
바 색상: 통합된 PVA 분석