
Deskripsi
Tinggi / Rendah Hari Sebelumnya – Virgin Levels Ultimate
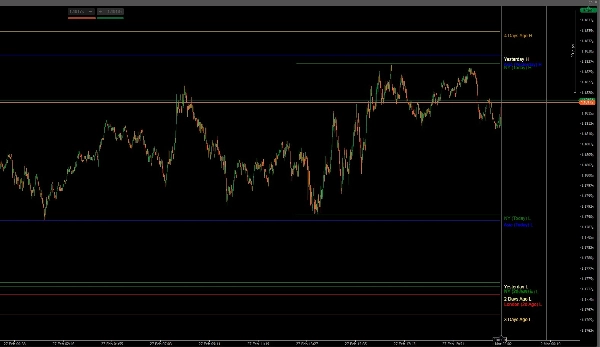
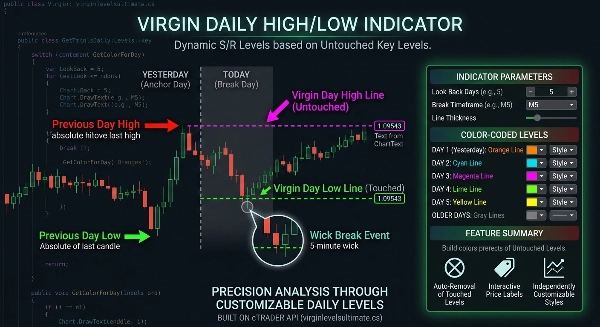
Virgin Levels Ultimate adalah indikator pelacakan level presisi yang secara otomatis memplot titik tertinggi dan terendah yang belum tersentuh dari hari perdagangan sebelumnya dan mempertahankannya di grafik Anda sampai harga menembusnya.
Dibuat untuk trader yang memahami bahwa level likuiditas yang belum tersentuh bertindak sebagai magnet bagi harga, alat ini memberi Anda kerangka kerja yang bersih dan terstruktur untuk eksekusi breakout dan pembalikan.
Sekarang diperluas dengan tinggi/rendah sesi Asia, London, dan New York, plus level Mingguan dan Bulanan Sebelumnya, menciptakan peta likuiditas multi-timeframe yang lengkap.
Dirancang untuk Forex, indeks, emas, dan kripto — di semua timeframe.
Perdagangkan likuiditas utama. Perdagangkan dengan presisi.
⚙ Mesin Inti
- Deteksi otomatis tinggi dan rendah harian sebelumnya
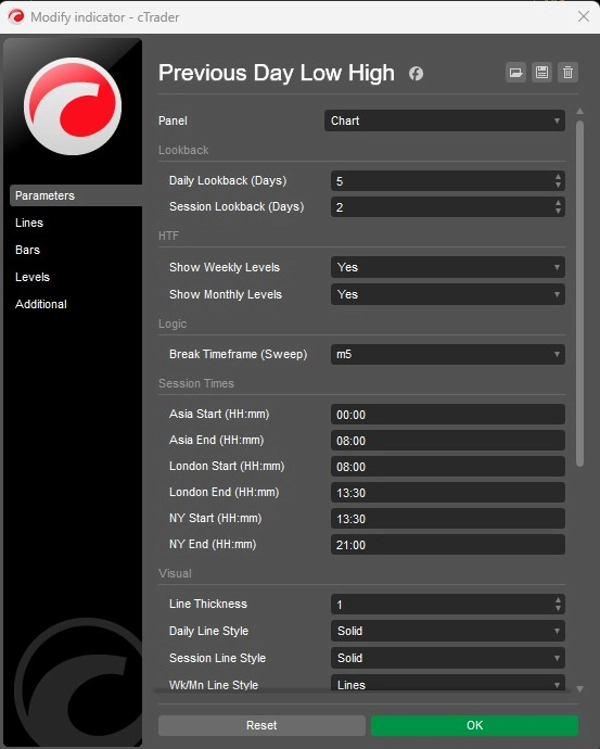
- Periode lookback harian yang dapat disesuaikan (melacak beberapa hari sebelumnya)
- Deteksi tinggi/rendah sesi Asia, London, dan New York
- Kontrol lookback sesi (melacak beberapa sesi sebelumnya)
- Tinggi / Rendah Mingguan Sebelumnya (opsional)
- Tinggi / Rendah Bulanan Sebelumnya (opsional)
- Level hanya aktif dari periode perdagangan valid berikutnya
- Penghapusan otomatis setelah level tersentuh (tidak berantakan)
- Deteksi breakout berdasarkan timeframe lebih rendah yang dapat dipilih
- Validasi level secara real-time
📊 Logika Virgin Level
- Memplot hanya titik tertinggi dan terendah yang belum tersentuh (virgin)
- Level Harian, Sesi, Mingguan, dan Bulanan dipisahkan dengan jelas
- Pelacakan multi-hari (Hari 1 sampai Hari 5+)
- Pelacakan sesi (Hari ini, Kemarin, lookback khusus)
- Hari-hari lama dibedakan secara visual
- Pemetaan support & resistance dinamis
- Kerangka breakout berbasis likuiditas
- Struktur konfluensi multi-timeframe
🕒 Deteksi Break Pintar
- Timeframe break yang dapat dipilih (misalnya, M5, M15, dll.)
- Presisi intraday untuk invalidasi level
- Pemindaian Tinggi/Rendah dari waktu aktivasi valid
- Bekerja di seluruh level Harian, Sesi, Mingguan, dan Bulanan
- Berhenti memplot segera setelah sentuhan terkonfirmasi
- Logika grafik bersih — tanpa overdraw historis
🎨 Kustomisasi Penuh
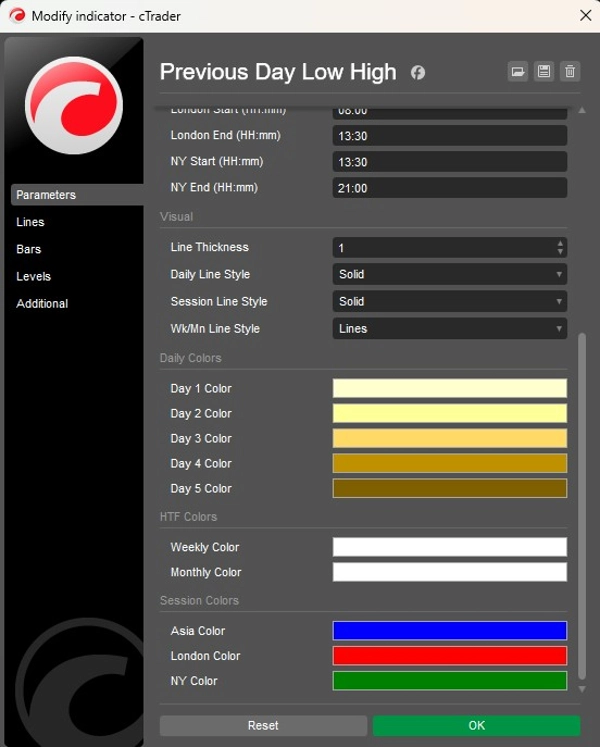
- Kontrol warna independen untuk setiap lookback harian
- Warna khusus untuk sesi Asia, London, dan New York
- Warna terpisah untuk level Mingguan dan Bulanan
- Gaya garis yang dapat disesuaikan (Harian / Sesi / HTF)
- Pengaturan ketebalan kustom
- Label harga otomatis dengan penumpukan pintar (tanpa tumpang tindih)
- Tampilan grafik minimalis dan profesional
🎯 Ideal Untuk
- Trader penyapu likuiditas
- Trader breakout & fakeout
- Trader gaya SMC / ICT
- Trader berbasis sesi (Asia, London, NY)
- Trader intraday dan swing
- Sistem berbasis aturan perusahaan prop
- Trader multi-aset (Forex, indeks, logam, kripto)
Ringkasan
Key features include automatic detection and plotting of prior highs and lows, customizable lookback periods for days and sessions, real-time validation, and automatic removal of levels once touched to reduce chart clutter. It visually distinguishes older levels and separates daily, session, weekly, and monthly levels with independent color and style customization. The tool supports dynamic support and resistance mapping and provides a liquidity-based breakout framework suitable for Forex, indices, gold, cryptocurrencies, and other markets.
This indicator is suitable for liquidity sweep traders, breakout and fakeout strategies, smart money concept (SMC) and institutional trading (ICT) styles, session-based trading, intraday and swing trading, prop firm rule-based systems, and multi-asset trading. It offers a professional, minimal chart appearance with auto price labels and smart stacking.
Ulasan pelanggan
5 | 100 % | |
4 | 0 % | |
3 | 0 % | |
2 | 0 % | |
1 | 0 % |


