
Описание
Индикатор Swing High / Low и Break of Structure
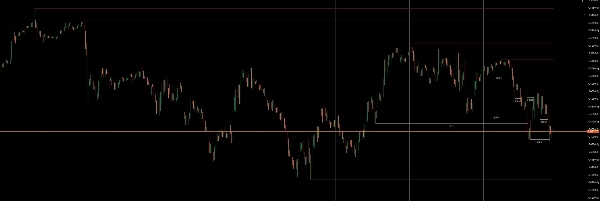
Чистая рыночная структура автоматически обнаруживает Swing Highs и Swing Lows и строит динамические уровни поддержки и сопротивления на основе подтвержденной структуры пивотов.
Уровни продолжаются вперед во времени, пока цена их не пробьет. Когда происходит Break of Structure (BOS), уровень преобразуется в историческую линию с меткой пробоя, что позволяет трейдерам быстро выявлять структурные сдвиги и ликвидностные выбросы.
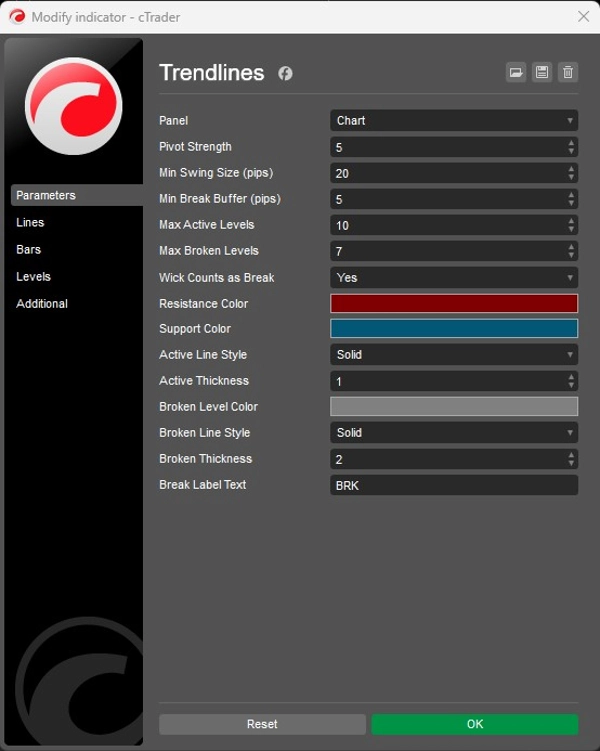
Индикатор включает фильтры, такие как минимальный размер свинга и буферы пробоя для игнорирования незначительных пивотов и фокусировки только на значимой рыночной структуре.
Активные и пробитые уровни используют отдельные визуальные стили, а встроенные ограничения поддерживают чистоту графика, контролируя количество видимых уровней.
Поскольку пивоты подтверждаются только после закрытия необходимого количества свечей, логика структуры является стабильной и не перерисовывающейся.
Ключевые особенности
• Автоматическое обнаружение Swing High / Swing Low
• Динамические уровни поддержки и сопротивления
• Автоматическая маркировка Break of Structure (BOS)
• Фильтр минимального свинга для устранения шума
• Опциональное обнаружение пробоя по фитилю или закрытию
• Отдельное оформление для активных и пробитых уровней
• Ограничения для активных и исторических уровней для поддержания чистоты графиков
• Логика пивотов без перерисовки
Идеально подходит для
• Трейдинга по Price Action
• Стратегий поддержки и сопротивления
• Трейдинга на основе ликвидности
• Систем Break of Structure
• Скальпинга, внутридневной и свинг-трейдинга
Сводка
Отзывы покупателей
5 | 67 % | |
4 | 33 % | |
3 | 0 % | |
2 | 0 % | |
1 | 0 % |


