
Descrição
Máxima / Mínima do Dia Anterior – Virgin Levels Ultimate
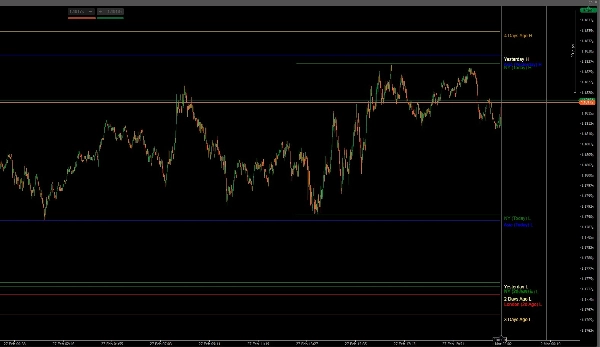
Virgin Levels Ultimate é um indicador de rastreamento de níveis de precisão que plota automaticamente máximas e mínimas não tocadas dos dias de negociação anteriores e as mantém no seu gráfico até que o preço as ultrapasse.
Desenvolvido para traders que entendem que níveis de liquidez intocados atuam como ímãs para o preço, esta ferramenta oferece uma estrutura limpa e estruturada para execução de rompimentos e reversões.
Agora estendido com máximas/mínimas das sessões da Ásia, Londres e Nova York, além de níveis Semanais e Mensais Anteriores, criando um mapa completo de liquidez multi-temporal.
Projetado para Forex, índices, ouro e criptomoedas — em todos os intervalos de tempo.
Negocie liquidez chave. Negocie com precisão.
⚙ Motor Principal
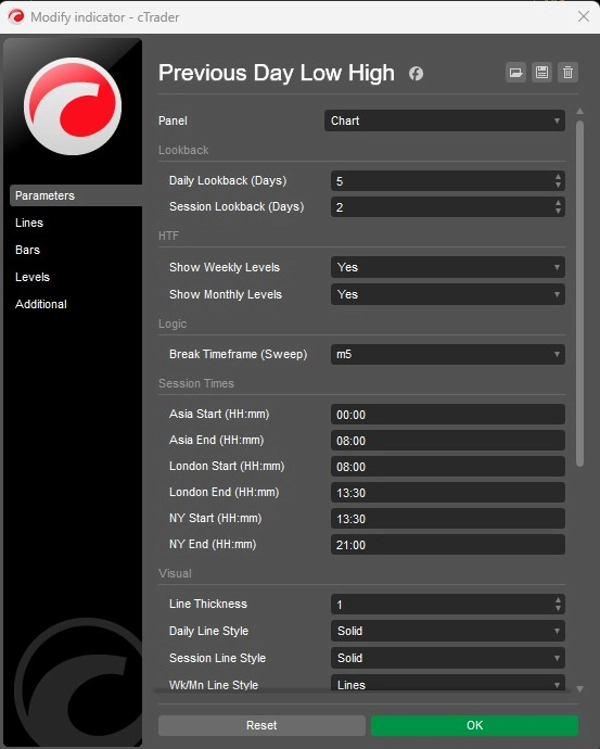
- Detecção automática das máximas e mínimas diárias anteriores
- Período de retrocesso diário personalizável (acompanhe vários dias passados)
- Detecção de máxima/mínima das sessões da Ásia, Londres e Nova York
- Controle de retrocesso de sessão (acompanhe várias sessões anteriores)
- Máxima / Mínima Semanal Anterior (opcional)
- Máxima / Mínima Mensal Anterior (opcional)
- Níveis ativam apenas a partir do próximo período válido de negociação
- Remoção automática assim que o nível é tocado (sem desordem)
- Detecção de rompimento baseada em timeframe inferior selecionável
- Validação de nível em tempo real
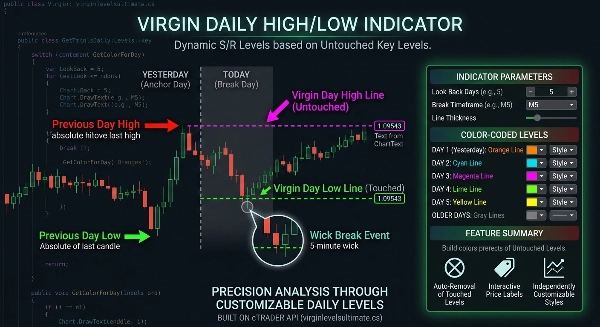
📊 Lógica do Nível Virgin
- Plota apenas máximas e mínimas intocadas (virgens)
- Níveis Diários, de Sessão, Semanais e Mensais claramente separados
- Rastreamento multi-dia (Dia 1 a Dia 5+)
- Rastreamento de sessão (Hoje, Ontem, retrocesso personalizado)
- Dias mais antigos visualmente diferenciados
- Mapeamento dinâmico de suporte & resistência
- Estrutura de rompimento baseada em liquidez
- Estrutura de confluência multi-timeframe
🕒 Detecção Inteligente de Rompimento
- Timeframe de rompimento selecionável (ex.: M5, M15, etc.)
- Precisão intradiária para invalidação de nível
- Varredura de máxima/mínima a partir do horário válido de ativação
- Funciona em níveis Diários, de Sessão, Semanais e Mensais
- Para de plotar imediatamente após toque confirmado
- Lógica limpa de gráfico — sem sobreposição histórica
🎨 Personalização Completa
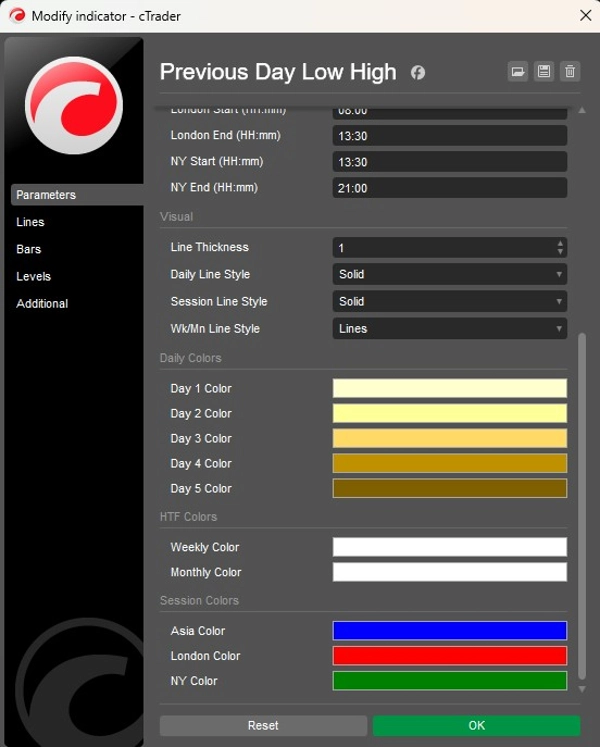
- Controle de cor independente para cada retrocesso diário
- Cores dedicadas para as sessões da Ásia, Londres e Nova York
- Cores separadas para níveis Semanais e Mensais
- Estilos de linha ajustáveis (Diário / Sessão / HTF)
- Configurações personalizadas de espessura
- Etiquetas de preço automáticas com empilhamento inteligente (sem sobreposição)
- Aparência minimalista e profissional do gráfico
🎯 Ideal Para
- Traders de varredura de liquidez
- Traders de rompimento e falso rompimento
- Traders estilo SMC / ICT
- Traders baseados em sessão (Ásia, Londres, NY)
- Traders intradiários e swing
- Sistemas baseados em regras para firmas proprietárias
- Traders multiativos (Forex, índices, metais, criptomoedas)
Resumo
Key features include automatic detection and plotting of prior highs and lows, customizable lookback periods for days and sessions, real-time validation, and automatic removal of levels once touched to reduce chart clutter. It visually distinguishes older levels and separates daily, session, weekly, and monthly levels with independent color and style customization. The tool supports dynamic support and resistance mapping and provides a liquidity-based breakout framework suitable for Forex, indices, gold, cryptocurrencies, and other markets.
This indicator is suitable for liquidity sweep traders, breakout and fakeout strategies, smart money concept (SMC) and institutional trading (ICT) styles, session-based trading, intraday and swing trading, prop firm rule-based systems, and multi-asset trading. It offers a professional, minimal chart appearance with auto price labels and smart stacking.
Avaliações de clientes
5 | 100 % | |
4 | 0 % | |
3 | 0 % | |
2 | 0 % | |
1 | 0 % |


