
Deskripsi
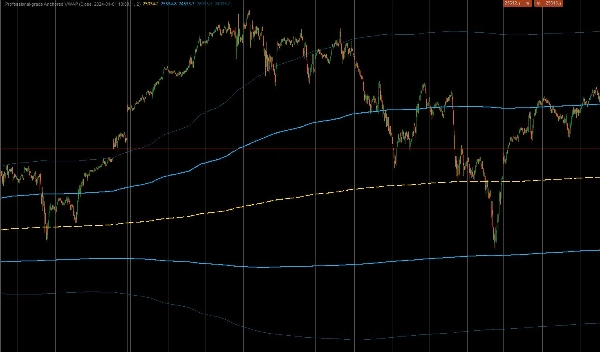
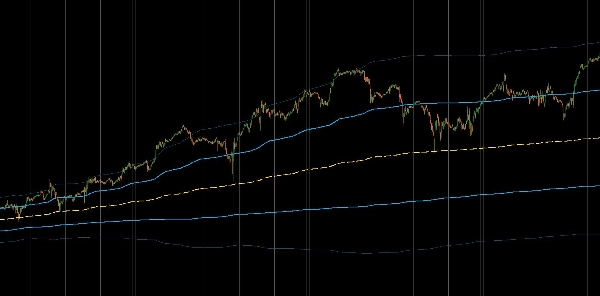
Ini adalah indikator kustom tingkat profesional untuk cTrader yang dirancang untuk menghitung Anchored Volume Weighted Average Price (AVWAP). Berbeda dengan indikator VWAP standar yang direset setiap hari, alat ini memungkinkan trader untuk "menambatkan" perhitungan pada peristiwa berdampak tinggi tertentu—seperti rilis CPI, kejatuhan pasar, atau awal tren—memberikan pandangan institusional yang sebenarnya tentang harga rata-rata sejak saat itu. Ini juga mencakup Volume-Weighted Standard Deviation Bands untuk mengidentifikasi aksi harga yang terlalu meluas.
1. Perhitungan Inti & Logika Penambatan
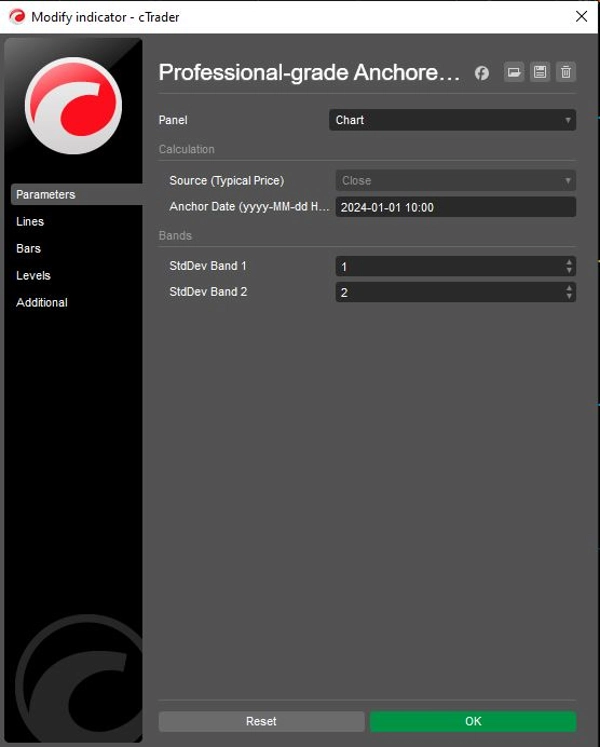
- Penambatan Presisi: Indikator menggunakan
Tanggal Penambatanyang ditentukan pengguna (misalnya, "2024-01-01 10:00") untuk secara ketat mengabaikan semua data sebelum menit tertentu tersebut. Ini memastikan harga rata-rata hanya mencerminkan partisipan yang terlibat dalam pergerakan atau kerangka waktu spesifik saat ini. - Formula Institusional: Ini menghitung VWAP yang sebenarnya menggunakan jumlah kumulatif dari (Harga × Volume) dibagi dengan jumlah kumulatif Volume.
- Sumber Harga Tipikal: Secara default, menggunakan
"Harga Tipikal" (High + Low + Close) / 3untuk perhitungan, yang merupakan metode standar yang digunakan oleh algoritma institusional untuk menentukan nilai wajar, meskipun ini dapat disesuaikan ke harga Open atau Close.
2. Pita Volatilitas Lanjutan
Untuk membantu trader mengukur ekstrem pasar, indikator menghitung dua set pita dinamis berdasarkan Variansi Berbobot Volume:
- Pita 1 (Zona Nilai): Default ke 1,0 Deviasi Standar. Zona dalam ini biasanya berisi "noise" nilai wajar pasar. Breakout dari zona ini sering menandakan momentum.
- Pita 2 (Zona Ekstrem): Default ke 2,0 Deviasi Standar. Harga yang mencapai pita luar ini secara statistik terlalu meluas, sering menandakan peluang mean-reversion potensial (mengurangi pergerakan) atau kelelahan tren yang kuat.
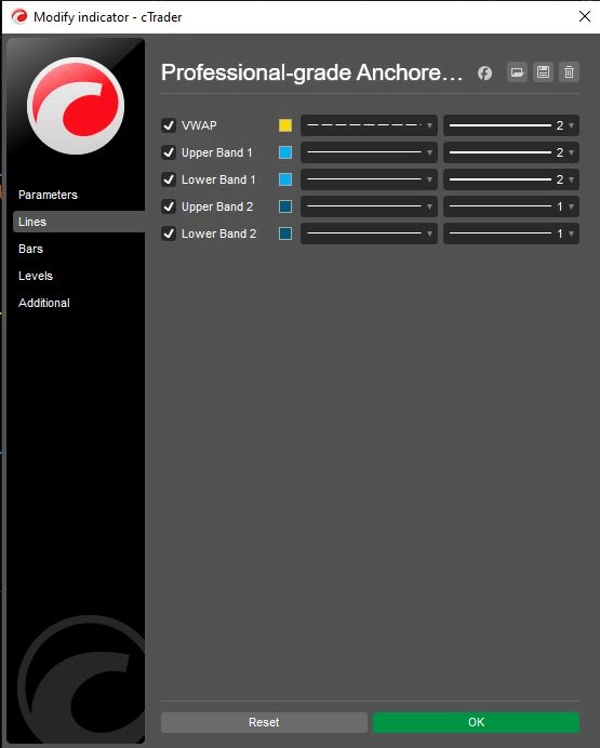
- Kontrol Independen: Kedua pita mencakup toggle
Tampilkanindividual (ShowBand1,ShowBand2) dan pengali deviasi yang dapat disesuaikan (Band1Dev,Band2Dev), memungkinkan grafik yang bersih yang disesuaikan dengan strategi volatilitas tertentu.
3. Logika Visual & Operasional
- Pengkodean Warna Strategis:
-
- Kuning (VWAP): Berfungsi sebagai "magnet" pusat atau garis dasar tren.
- Hijau Limau (Pita 1): Mewakili "Area Nilai" dukungan/resistensi langsung.
- Merah (Pita 2): Menyoroti deviasi ekstrem di mana probabilitas pembalikan meningkat.
- Preservasi Status: Kode menggunakan
IndicatorDataSeriesuntuk variabel status internal (_cumVol,_cumPV), memastikan nilai tetap akurat selama perhitungan ulang historis dan pembaruan waktu nyata tanpa kesalahan repainting.
Ringkasan Alur Logika
- Inisialisasi: Mengurai string Tanggal Penambatan spesifik pengguna menjadi objek DateTime sistem.
- Filter Waktu: Untuk setiap bar, periksa apakah waktu saat ini sebelum Penambatan. Jika ya, kembalikan
NaN(tidak menggambar apa pun) dan reset penghitung kumulatif ke nol. - Akumulasi Data: Setelah waktu Penambatan tercapai, mulai menambahkan Volume bar saat ini dan (Harga × Volume) ke total berjalan.
- Hitung VWAP: Bagikan Total PV Berjalan dengan Total Volume Berjalan untuk mendapatkan garis VWAP.
- Hitung Variansi: Hitung variansi berbobot volume dan turunkan Deviasi Standar.
- Plot Pita: Tambahkan/Kurangkan Deviasi yang dihitung dari VWAP untuk memplot pita Hijau Limau dan Merah.
Ringkasan
Key features include:
- Precision anchoring to a user-specified date and time, ignoring data before that moment.
- Institutional VWAP calculation using cumulative (Price × Volume) divided by cumulative Volume.
- Default use of Typical Price ((High + Low + Close) / 3) for fair value, adjustable to Open or Close prices.
- Two dynamic volatility bands based on volume-weighted variance: Band 1 (1 standard deviation) representing the value zone, and Band 2 (2 standard deviations) indicating extreme price deviations.
- Independent toggles and customizable deviation multipliers for each band.
- Strategic color coding: yellow for VWAP, lime green for Band 1, and red for Band 2.
- Internal state preservation ensures accurate values during historical and real-time updates without repainting.
The indicator supports markets including Forex, indices, commodities, stocks, and cryptocurrencies, and is suitable for various symbols such as BTCUSD, EURUSD, GBPUSD, XAUUSD, and NAS100.
Ulasan pelanggan
5 | 50 % | |
4 | 50 % | |
3 | 0 % | |
2 | 0 % | |
1 | 0 % |


