
Описание
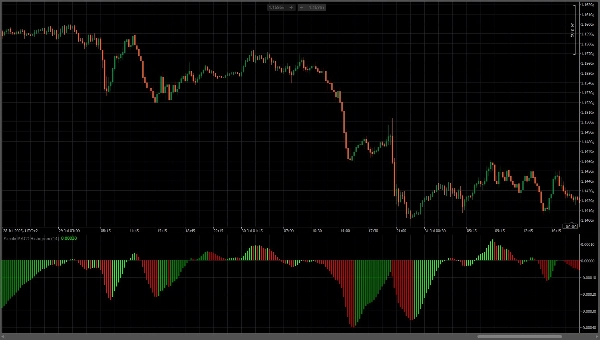
Этот пользовательский индикатор MACD Histogram отображает гистограмму MACD с улучшенной визуальной четкостью. Индикатор использует быстрый период EMA равный 14, автоматически вычисляет медленный EMA как быстрый плюс 2 (16). Индикатор характеризуется высококонтрастным цветовым кодированием для мгновенного распознавания тренда: ярко-зеленые бары указывают на растущий импульс (бычий), а красные бары показывают падающий импульс (медвежий). Бары гистограммы симметрично расширяются от центральной нулевой линии, создавая интуитивно понятное визуальное представление, где зеленый сигнализирует о давлении покупателей, а красный — о давлении продавцов. Этот стиль визуализации обеспечивает четкие, однозначные сигналы импульса и помогает выявлять потенциальные развороты тренда и изменения импульса в движении цены.


