

Описание
Те, кто занимается торговлей, знают, как важно учитывать предыдущую сессию.
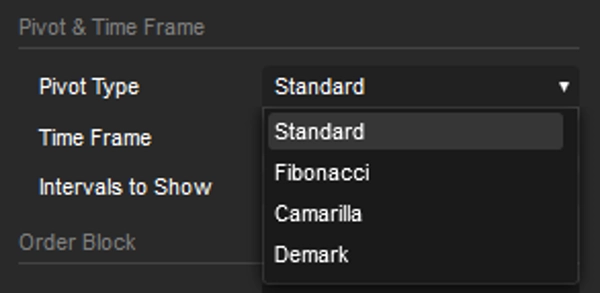
Я подготовил этот индикатор Pivot с интервалами от 15 минут до месяца, и он включает блоки ордеров и трендовые линии. Обе опции основаны на самых высоких и низких точках предыдущей сессии.
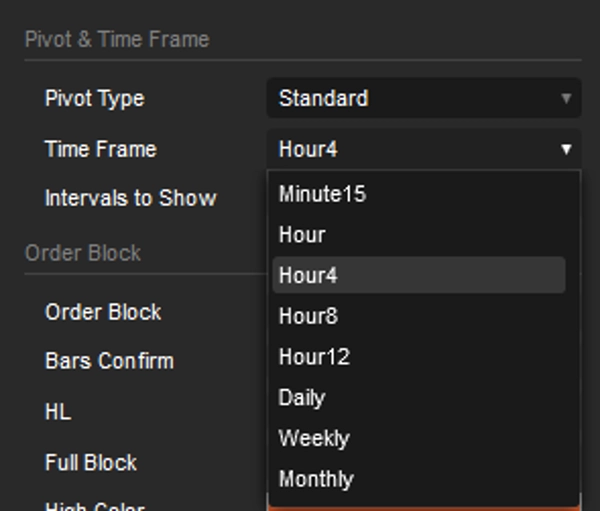
Конфигурация по умолчанию настроена на таймфрейм 5 минут.
Пивот установлен на 4 часа, а интервал — 5, что означает, что он смотрит назад на 20 часов с интервалами по 4 часа. Это идеально для тех, кто торгует ежедневно.
Однако, если вы поклонник Swing Trading, вам нужно только изменить интервал Pivot; всё остальное настраивается автоматически.
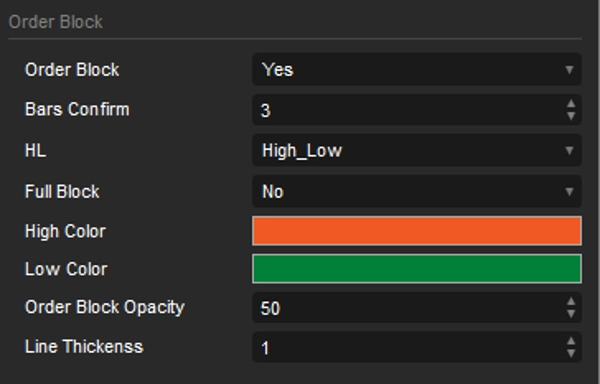
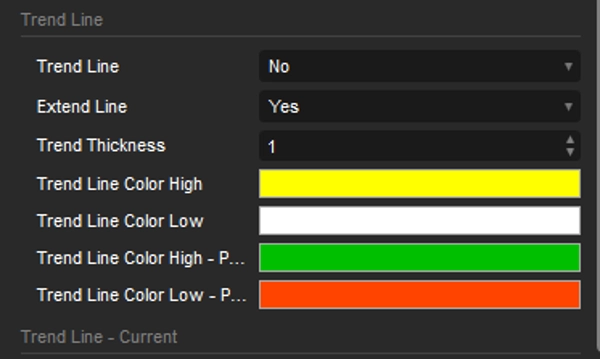
Блоки ордеров выделяют потенциальные зоны, где цена может найти поддержку или сопротивление, предоставляя понимание возможных разворотов или продолжений. Комбинируя их с автоматически построенными трендовыми линиями для выбранного таймфрейма, трейдеры могут точнее определить возможное направление цены и потенциальные точки входа или выхода. Возможность визуализировать эти трендовые линии на нескольких таймфреймах обеспечивает более полное понимание структуры рынка.
С дополнительными инструментами, такими как
OrderPrice V3 https://ctrader.com/products/397
NTMPICLL https://ctrader.com/products/327
Range Box Level https://ctrader.com/products/245
Or RangeBoxFibonacci https://ctrader.com/products/526
Market Session https://ctrader.com/products/94
MacdVolume https://ctrader.com/products/267
4MA https://ctrader.com/products/247
Вы будете непобедимы
Удачи 😀
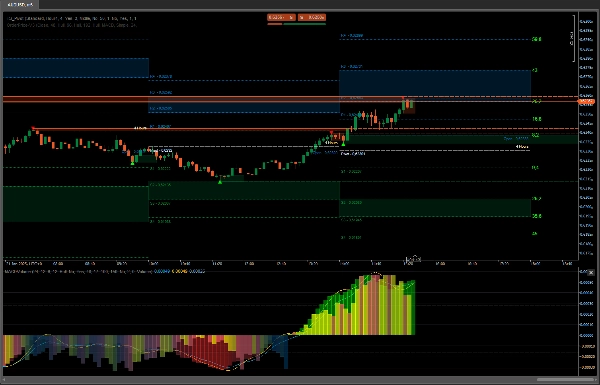
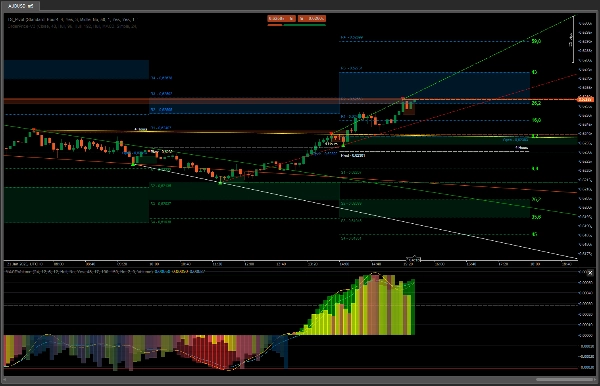
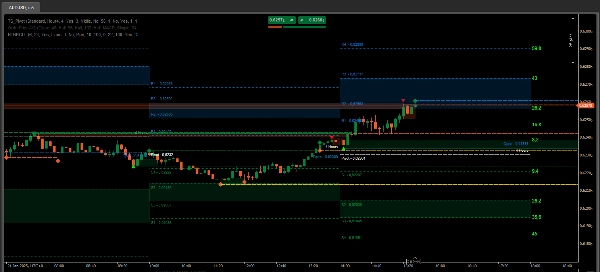
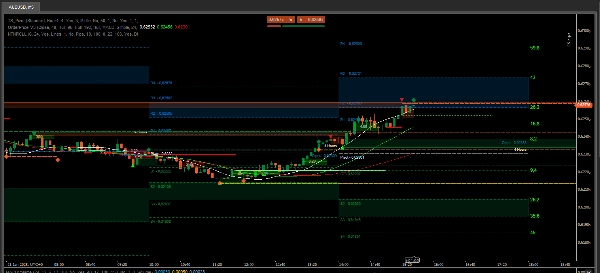
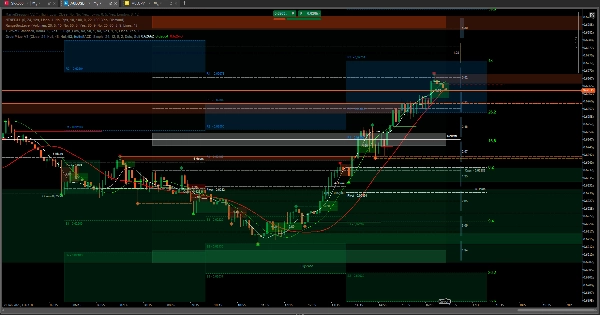
В случае покупки, наблюдая на последних двух изображениях поведение OrderPrice и встроенных скользящих средних, когда появляется зелёная линия, а скользящая средняя находится ниже, это идеальный момент для открытия сделки на покупку.
Используя данные предыдущей сессии, вы можете определить, насколько далеко может пойти цена или где может возникнуть сопротивление. Если она пробьёт уровень, возможно продолжение до второй точки, которая может быть нейтральной зоной RangeBoxLevel. Если цена превысит этот уровень и не будет признаков того, что скользящие средние хотят изменить направление, цена может достичь зоны блока ордеров предыдущей сессии.
На последнем изображении представлен скриншот идеальной ситуации для входа и выхода из сделки. Остальное — просто наблюдение и выводы.
Эти инструменты необходимы, когда речь идёт о победе в торговле активами.
Сводка
Key features include the integration of order blocks and trend lines derived from previous session data. Order blocks identify potential support and resistance zones, aiding in spotting possible price reversals or continuations. The indicator automatically generates trend lines for the selected timeframe, helping traders assess market structure and potential price direction. Visualizing these trend lines across multiple timeframes enhances market analysis.
TS_Pivot can be used alongside complementary tools such as OrderPrice V3, NTMPICLL, Range Box Level, RangeBoxFibonacci, Market Session, MacdVolume, and 4MA to refine entry and exit decisions. By combining moving averages and order block signals, traders can identify optimal moments to open buy or sell positions. The indicator supports various markets including Forex, cryptocurrencies, commodities, indices, and stocks.
Отзывы покупателей
5 | 100 % | |
4 | 0 % | |
3 | 0 % | |
2 | 0 % | |
1 | 0 % |


