
Описание
Этот индикатор технического анализа предоставляет информацию о настроениях рынка, тренде и уровнях цен. Он использует данные, такие как объем, Open_Close, волатильность Чайкина и денежный поток Чайкина для расчета настроений рынка. Также он позволяет настраивать спреды, обнаруживать тренды и визуализировать уровни цен и пункты. Это полезный инструмент для определения преобладающей силы на рынке, прогнозирования движений цен и улучшения принятия торговых решений.
В описании я указываю важные параметры; остальные — это настройки стиля, такие как цвет, тип линии и размер шрифта.
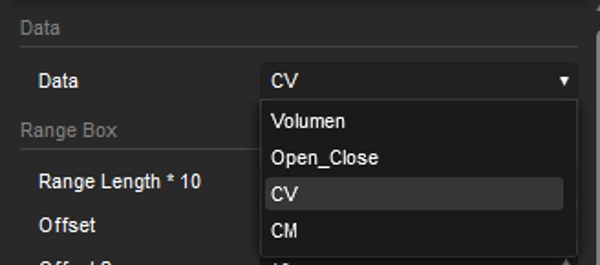
Данные
Расчеты настроений основаны на выборе из Volume, Open_Close, Chaikin Volatility и Chaikin Money Flow.
Длина диапазона * 10
Значение указывает количество свечей (периодов), на которых основан расчет – значение умножается на 10.
Добавить масштаб
Чтобы сохранить центрирование графика, это также помогает учитывать ситуации, такие как консолидация и изменения тренда.
Отступ
Позволяет регулировать верхние и нижние отступы для улучшения визуализации.
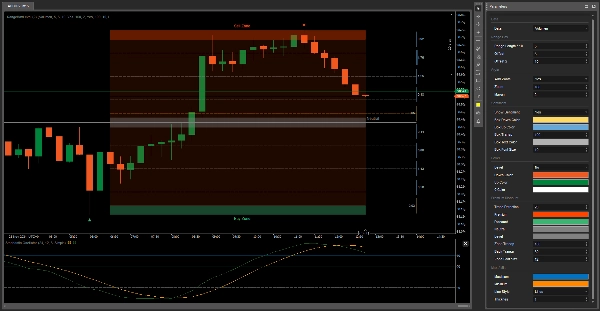
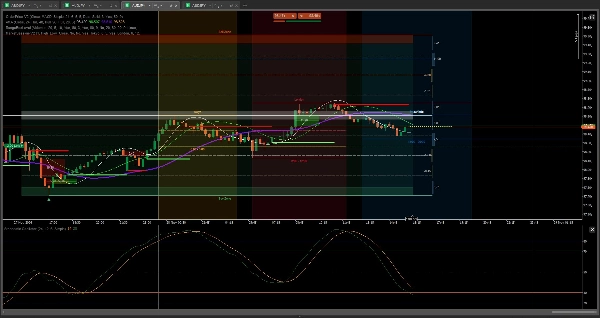
Показать настроение
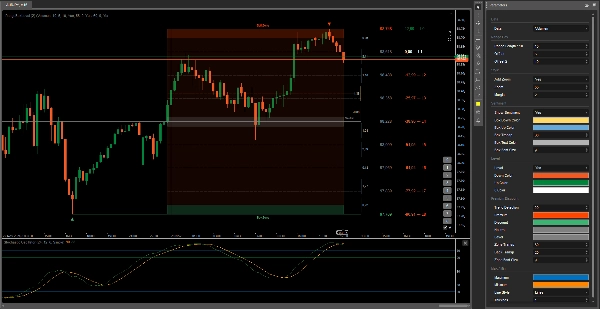
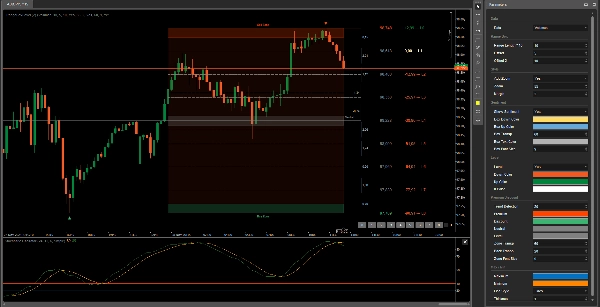
Настроение показывает, какая сила в данный момент сильнее на рынке. Если желтые бары увеличиваются в размере, это означает, что продавцов больше, и наоборот. Если вы не хотите видеть визуализацию настроения, вы можете скрыть ее справа.
Уровень
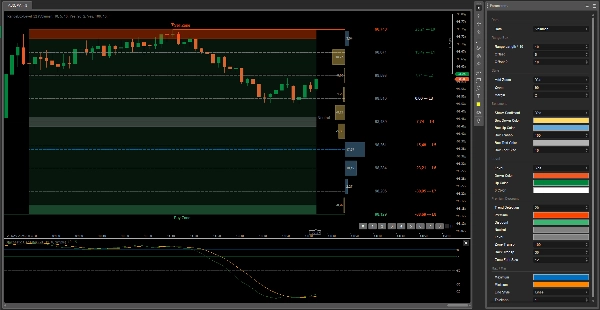
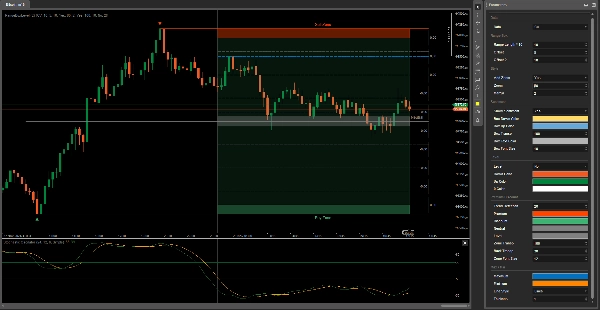
Это дополнительная функция, которую можно использовать в качестве ориентира для цен и пунктов на каждом уровне. Когда вы выбираете уровень, на котором хотите разместить ордер на покупку, он показывает пункты на каждом уровне, которых цена может достичь.
Обнаружение тренда
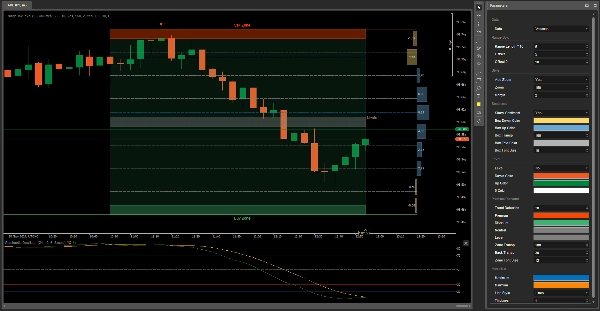
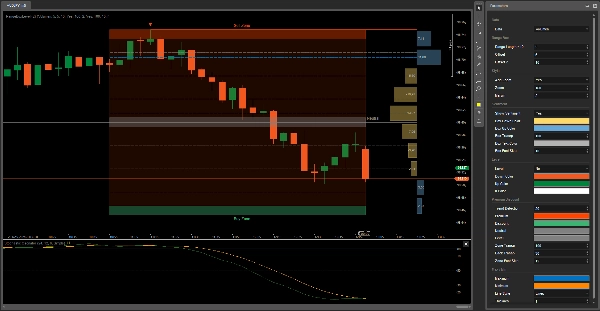
В зависимости от тренда актива фон Range Box меняется: зеленый, если тренд восходящий, и красный, если нисходящий.
Макс / Мин
Это синие и желтые линии, которые меняют свое положение в зависимости от прогноза, куда может пойти цена. Range Box разделен на 9 секций, чтобы помочь определить точки перегиба цены, служащие в качестве уровней Фибоначчи.
Вы будете непобедимы
Удачи 😀
Сводка
Key features include sentiment visualization with bars indicating the dominance of buyers or sellers, trend detection through background color changes (green for bullish, red for bearish), and level indicators that display potential price and pip targets for placing orders. The Range Box is divided into nine sections to identify price inflection points, functioning similarly to Fibonacci retracement levels, with dynamic max/min lines predicting possible price movements.
This tool supports analysis across various markets including stocks, cryptocurrencies, indices like NAS100, and commodities such as XAUUSD (gold). It is suitable for trading strategies like scalping and grid trading and can assist traders in anticipating price movements and making informed decisions. The indicator integrates with additional tools for enhanced order price management and market session analysis.
Отзывы покупателей
5 | 100 % | |
4 | 0 % | |
3 | 0 % | |
2 | 0 % | |
1 | 0 % |


