
Описание
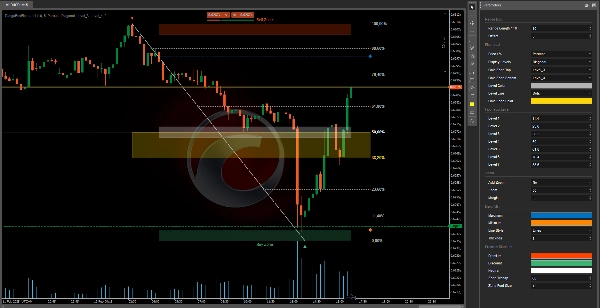
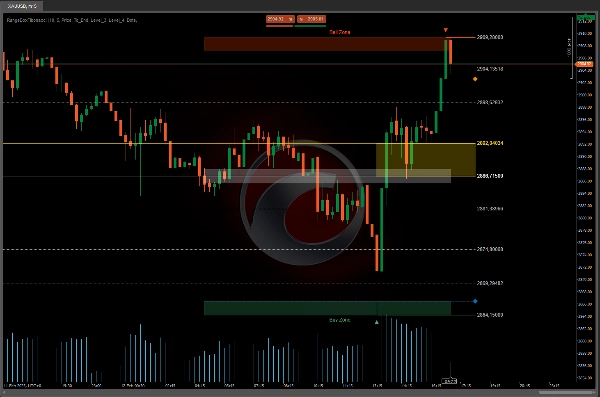
Этот индикатор уровней Фибоначчи позволяет трейдерам визуализировать и настраивать ключевые уровни коррекции для определения потенциальных зон покупки и продажи на рынке.
В дополнение к цветным "Зоне продажи" и "Зоне покупки" пользователи могут регулировать уровни Фибоначчи по своему усмотрению.
Этот индикатор дополняется отдельным индикатором оповещений для более полного торгового опыта.
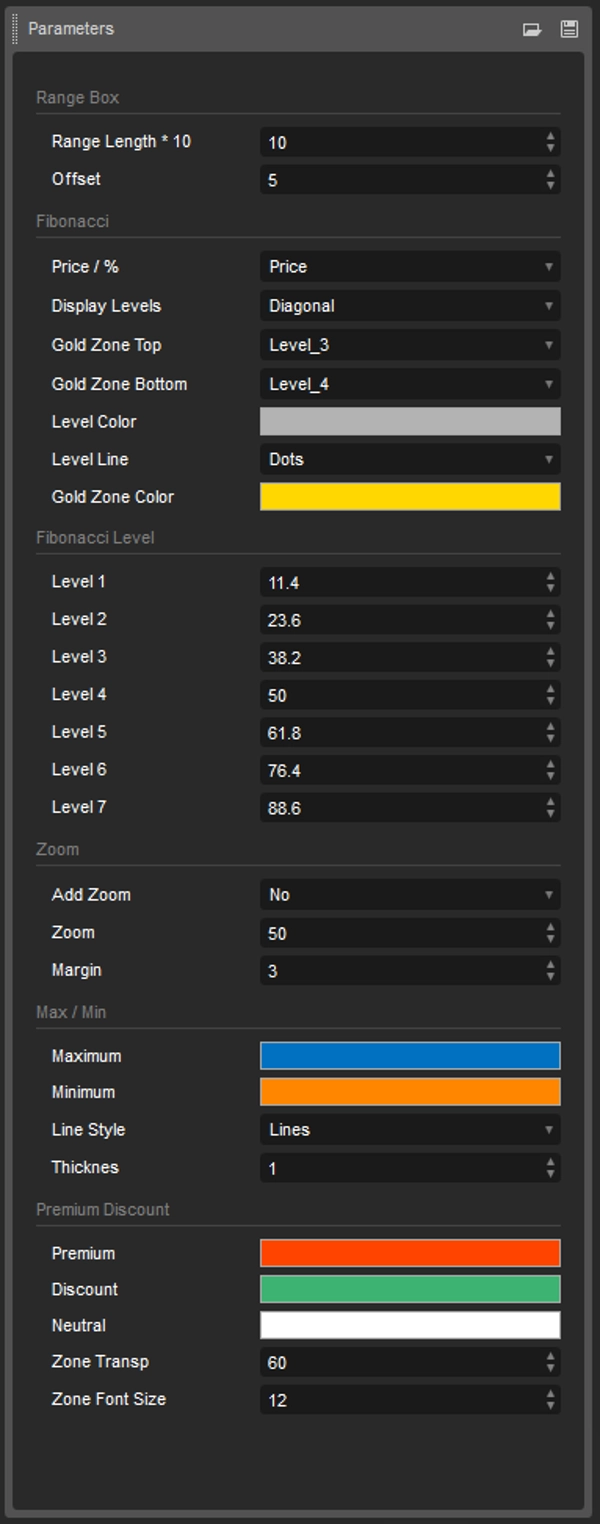
С этим индикатором уровней Фибоначчи трейдеры имеют полный контроль над отображаемыми на графике уровнями коррекции.
Возможность настраивать уровни Фибоначчи, а также цветные зоны и отдельный индикатор оповещений позволяет пользователям адаптировать инструмент под свои индивидуальные торговые стратегии.
Если вы включите такие инструменты, как:
- OrderPrice V3 https://ctrader.com/products/397
- NTMPICLL https://ctrader.com/products/327
- MACDVolume https://ctrader.com/products/267
- MarketSession-MX https://ctrader.com/products/525
Вы не рискуете потерять много денег.
Сводка
Отзывы покупателей
5 | 50 % | |
4 | 50 % | |
3 | 0 % | |
2 | 0 % | |
1 | 0 % |


