
Descrizione
Questo indicatore di analisi tecnica fornisce informazioni sul sentiment di mercato, sulla tendenza e sui livelli di prezzo. Utilizza dati come Volume, Open_Close, Chaikin Volatility e Chaikin Money Flow per calcolare il sentiment di mercato. Consente inoltre di regolare gli spread, rilevare le tendenze e visualizzare i livelli di prezzo e i pips. È uno strumento utile per identificare la forza prevalente nel mercato, anticipare i movimenti dei prezzi e migliorare le decisioni di trading.
Nella descrizione indico i parametri importanti; il resto sono configurazioni di stile come colore, tipo di linea e dimensione del carattere.
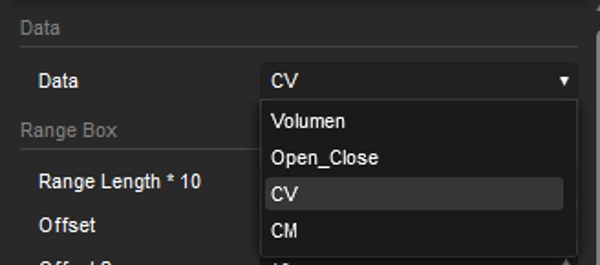
Dati
I calcoli del sentiment si basano sulla selezione tra Volume, Open_Close, Chaikin Volatility e Chaikin Money Flow.
Lunghezza Intervallo * 10
Il valore indica il numero di candele (periodi) su cui si basa il calcolo – il valore viene moltiplicato per 10.
Aggiungi Zoom
Per mantenere il grafico centrato, questo aiuta anche a considerare situazioni come consolidamento e cambiamenti di tendenza.
Margine
Consente di regolare i margini superiore e inferiore per migliorare la visualizzazione.
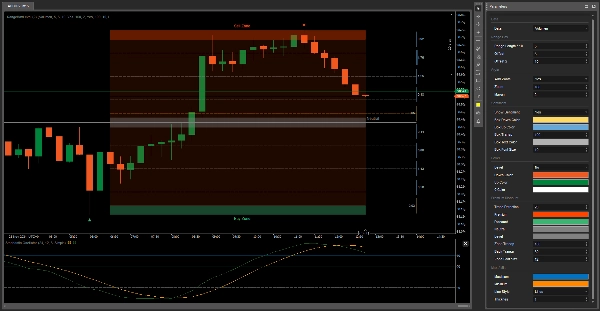
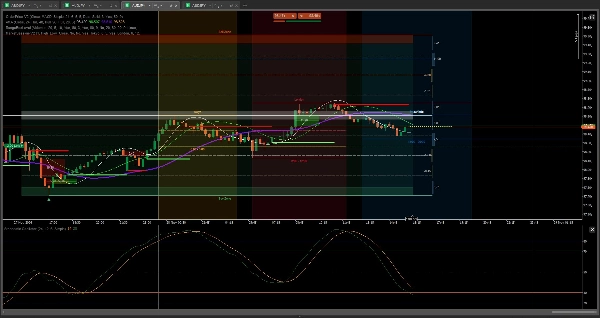
Mostra Sentiment
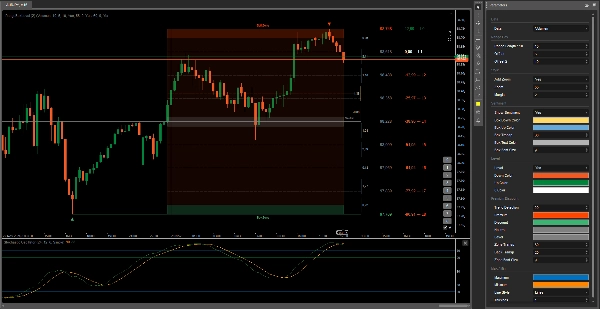
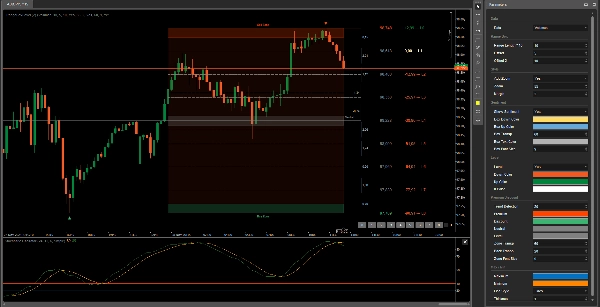
Il sentiment indica quale forza è più forte nel mercato in quel momento. Se le barre gialle aumentano di dimensione, significa che ci sono più venditori, e viceversa. Se non desideri vedere la visualizzazione del sentiment, puoi nasconderla sul lato destro.
Livello
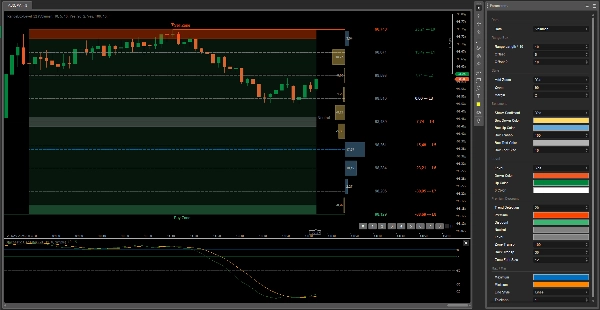
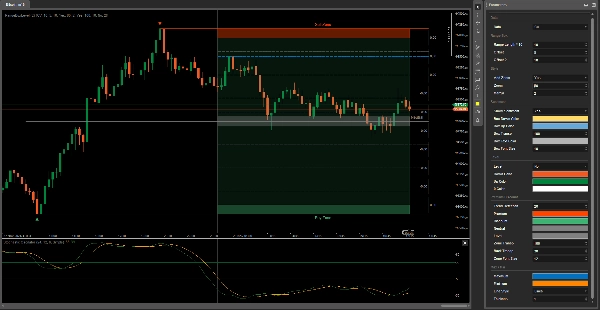
Questa è una funzione extra che può essere utilizzata come riferimento per prezzi e pips a ogni livello. Quando selezioni un livello dove vuoi piazzare l'ordine di acquisto, indica i pips a ogni livello che il prezzo può raggiungere.
Rilevamento Tendenza
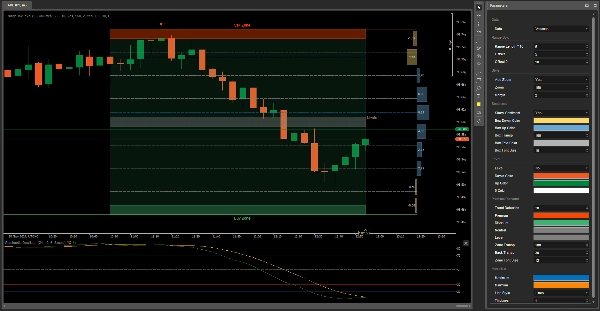
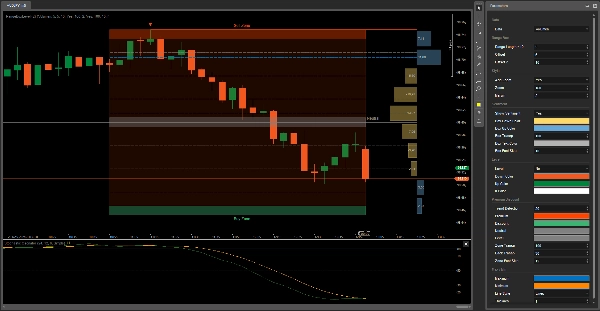
A seconda della tendenza dell'asset, lo sfondo del Range Box cambia: verde se è rialzista e rosso se è ribassista.
Max / Min
Queste sono le linee blu e gialle che cambiano posizione in base alla previsione di dove potrebbe andare il prezzo. Il Range Box è diviso in 9 sezioni per aiutare a determinare i punti di inflessione del prezzo, fungendo da Fibonacci Retracement.
Sarai invincibile
Buona fortuna 😀
Riepilogo
Key features include sentiment visualization with bars indicating the dominance of buyers or sellers, trend detection through background color changes (green for bullish, red for bearish), and level indicators that display potential price and pip targets for placing orders. The Range Box is divided into nine sections to identify price inflection points, functioning similarly to Fibonacci retracement levels, with dynamic max/min lines predicting possible price movements.
This tool supports analysis across various markets including stocks, cryptocurrencies, indices like NAS100, and commodities such as XAUUSD (gold). It is suitable for trading strategies like scalping and grid trading and can assist traders in anticipating price movements and making informed decisions. The indicator integrates with additional tools for enhanced order price management and market session analysis.
Recensioni dei clienti
5 | 100 % | |
4 | 0 % | |
3 | 0 % | |
2 | 0 % | |
1 | 0 % |


