Descrizione
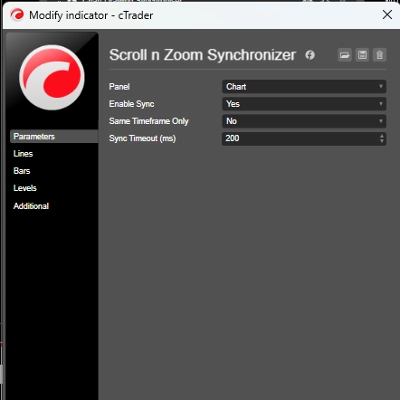
HTF Bias Detector — Edizione Pannello
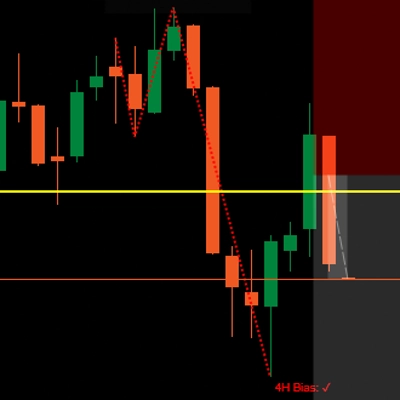
Vedi la storia del timeframe superiore a colpo d'occhio. HTF Bias Detector rende le ultime N candele di timeframe superiore in un pannello flottante direttamente sul tuo grafico — senza bisogno di cambiare timeframe — e identifica automaticamente il bias dominante utilizzando quattro pattern istituzionali di price action.
Come Funziona
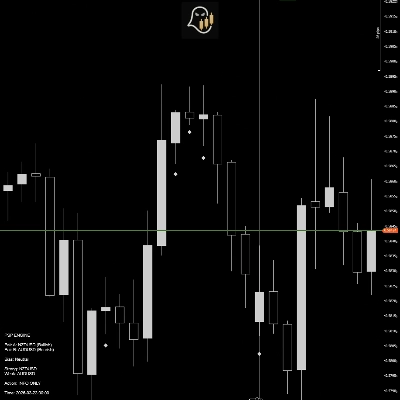
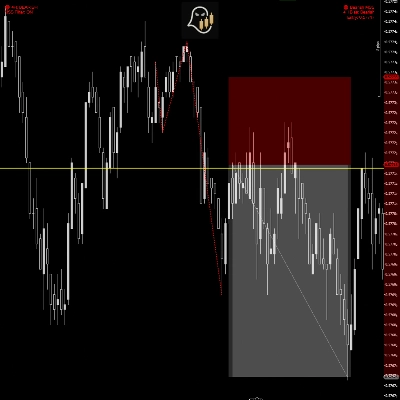
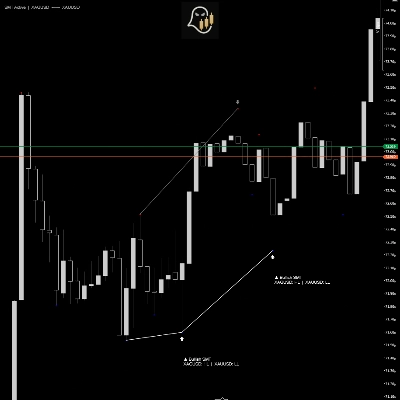
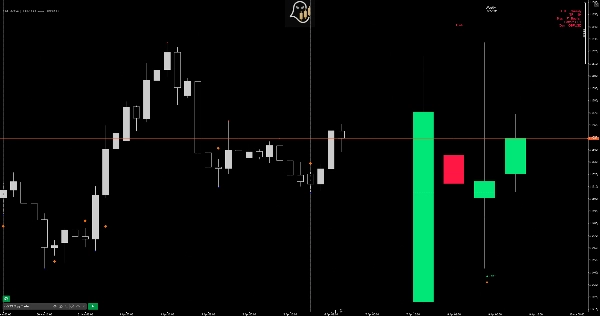
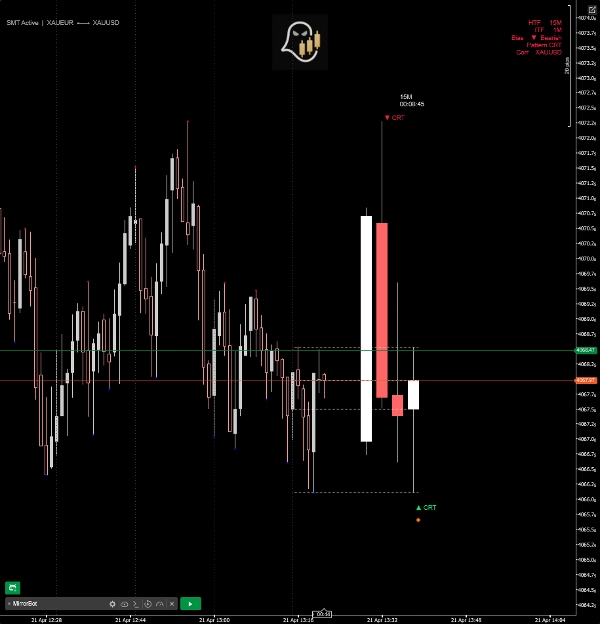
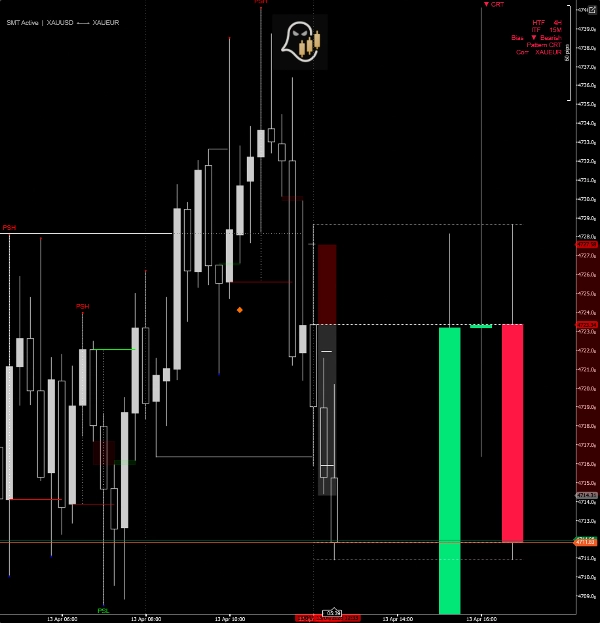
L'indicatore mappa il timeframe corrente del tuo grafico al suo naturale timeframe superiore (es. 5M → 1H, 1H → Giornaliero) e disegna quelle candele HTF in un pannello pulito ancorato a destra del prezzo. Il rilevamento dei pattern viene quindi eseguito su quelle candele in tempo reale.
Pattern Rilevati
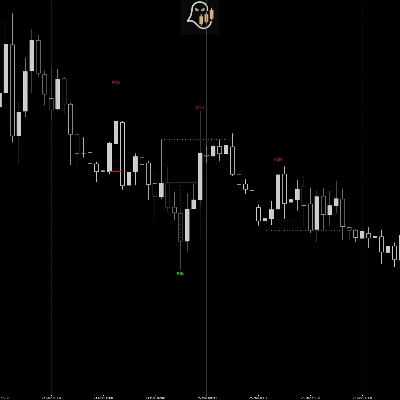
- CRT (Candle Range Theory) — identifica candele trappola che spazzano un massimo o minimo precedente e chiudono di nuovo all'interno, segnalando una probabile inversione.
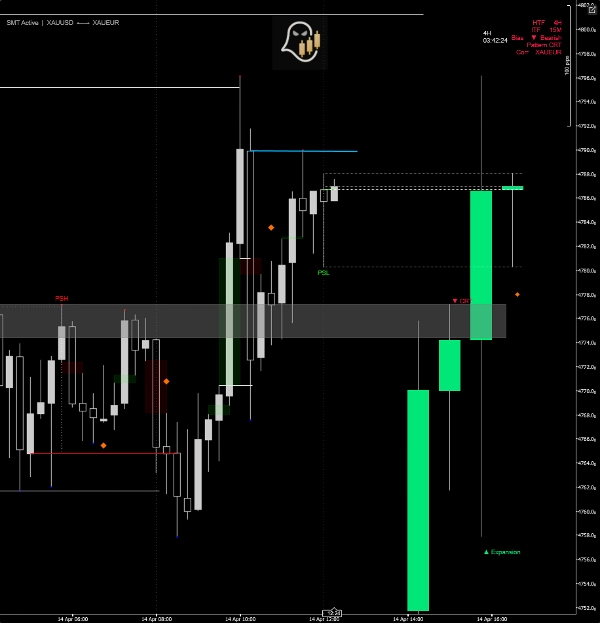
- Espansione — segnala candele che inglobano completamente il range precedente e chiudono oltre di esso, confermando un momentum direzionale.
- Punto di Swing — rileva sequenze di tre candele dove una candela di spostamento è seguita da una forte inversione, segnando un punto di svolta strutturale.
- PSP (Precision Swing Point) — segnale di divergenza cross-pair. Quando il simbolo principale e la sua coppia correlata stampano candele direzionali opposte sulla stessa barra HTF, viene tracciato un diamante PSP.
Divergenza SMT (Pannello HTF)
Confronta coppie di candele HTF consecutive tra strumenti correlati. Quando una coppia fa un minimo più basso mentre l'altra fa un minimo più alto (o viceversa sui massimi), una linea di divergenza SMT viene disegnata direttamente sul pannello con un'etichetta direzionale.
Rilevamento Automatico della Coppia Correlata
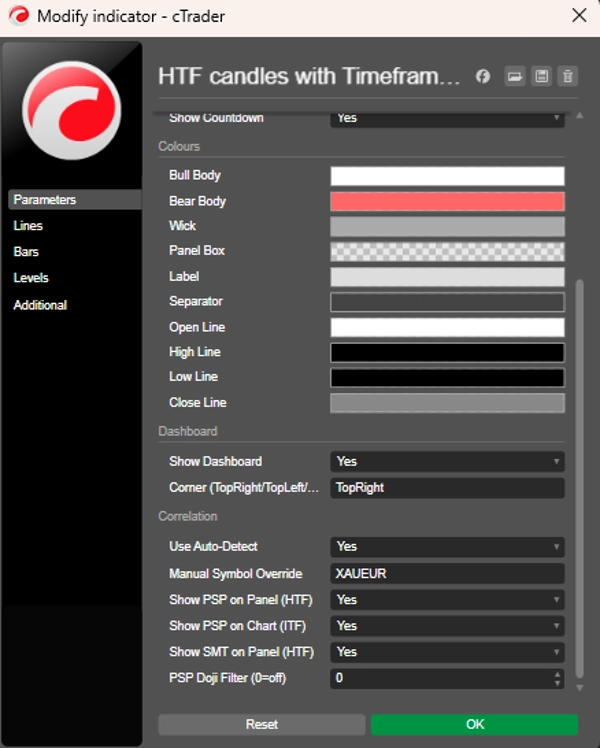
Risoluzione automatica dello strumento correlato per il simbolo del tuo grafico — coprendo le principali coppie forex, metalli, indici e criptovalute. È disponibile anche un override manuale per abbinamenti personalizzati o nomi di simboli specifici del broker.
Caratteristiche Aggiuntive
- Timer di conto alla rovescia live fino alla chiusura della prossima candela HTF
- Linee di riferimento tratteggiate OHLC per la candela HTF attualmente in formazione
- Separatore verticale sul grafico live allineato agli orari di apertura HTF
- Dashboard compatto che mostra HTF, ITF, bias rilevato, nome del pattern e coppia correlata
- Diamanti PSP ITF tracciati direttamente sulle barre del grafico (timeframe corrente)
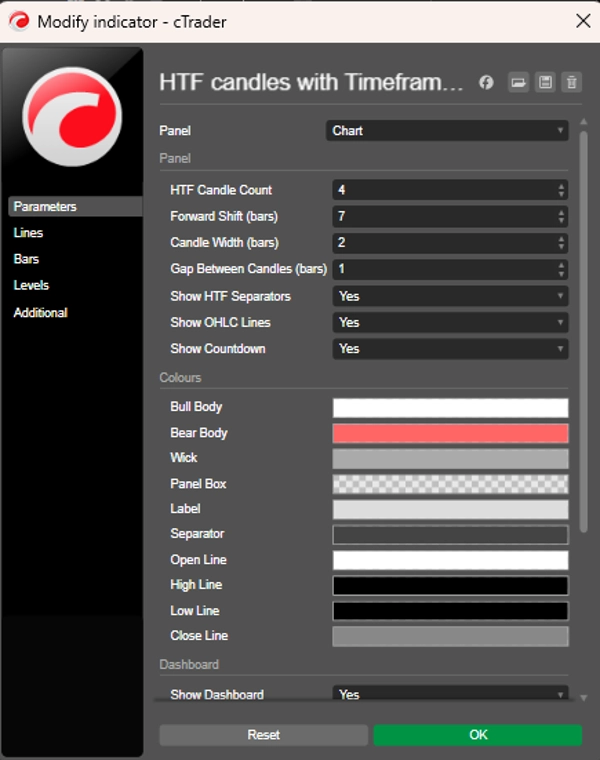
- Colori, larghezza del pannello, conteggio delle candele e posizionamento completamente personalizzabili
- Filtro Doji per sopprimere segnali PSP deboli
Mappa dei Timeframe
Chart TF Pannello HTF
1M – 4M 15M
5M – 10M 1H
15M – 30M 4H
1H Giornaliero
4H Settimanale
Giornaliero Mensile
Riepilogo
The indicator detects four institutional price action patterns in real time on these HTF candles: Candle Range Theory (CRT) trap candles signaling reversals, Expansion candles confirming momentum, Swing Point sequences marking structural turns, and Precision Swing Point (PSP) diamonds indicating cross-pair divergences. It also identifies SMT (Smart Money Technique) divergences between correlated instruments by comparing consecutive HTF candle pairs.
Correlated pairs are auto-detected for major forex pairs, metals, indices, and cryptocurrencies, with manual override options available. Additional features include a live countdown timer to the next HTF candle close, OHLC reference lines, vertical HTF open time separators, a compact dashboard showing HTF and intermediate timeframe bias and patterns, and customizable visual settings. The indicator supports multiple markets including forex, indices, and commodities.
Recensioni dei clienti
5 | 50 % | |
4 | 50 % | |
3 | 0 % | |
2 | 0 % | |
1 | 0 % |