Penerangan
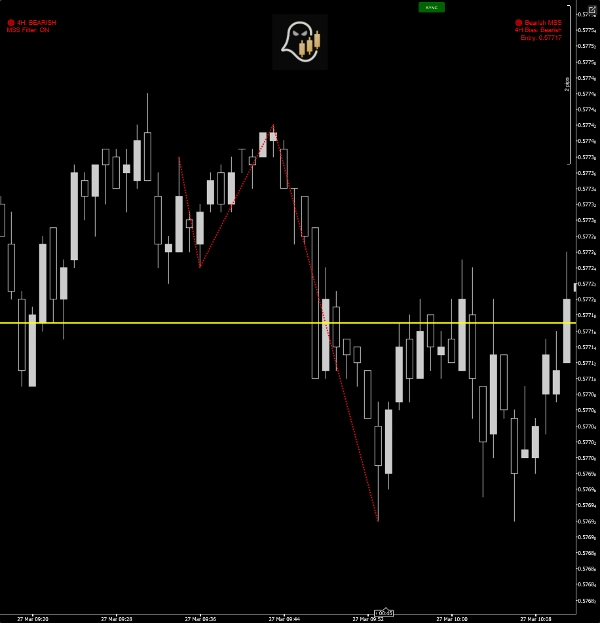
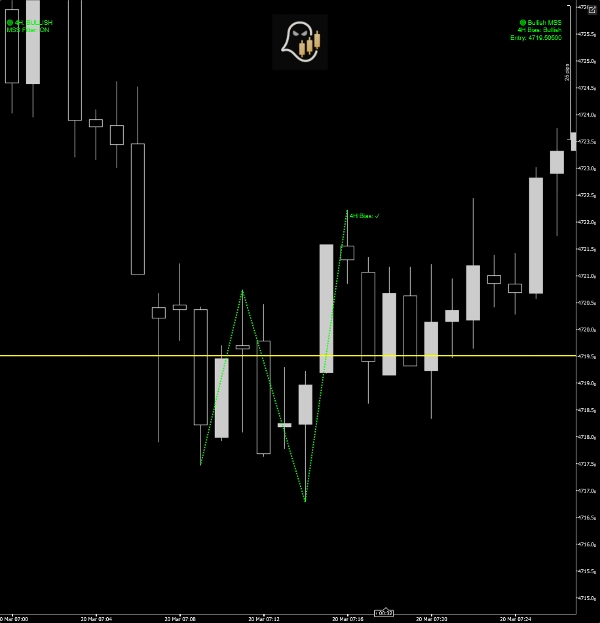
Penunjuk mengesan MSS (Perubahan Struktur Pasaran) corak yang dibina daripada fraktal tinggi dan rendah.
MSS yang sah memerlukan:
- Satu urutan 4 titik ayunan fraktal
- Pecahan struktur ayunan sebelumnya
- Pengesahan dalam arah bertentangan
- Pengesahan pilihan daripada bias 4H
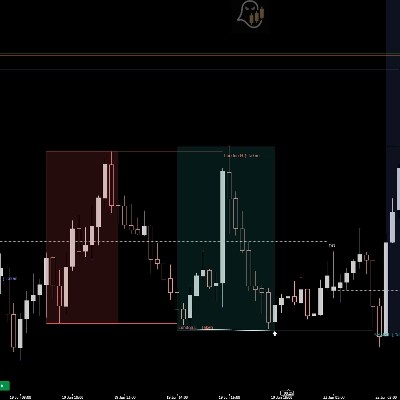
Apabila dikesan, penunjuk menyediakan:
- Garis corak visual
- Tahap kemasukan Fibonacci (50%)
- Panel amaran pada carta
- Amaran bunyi pilihan
- Paparan arah bias
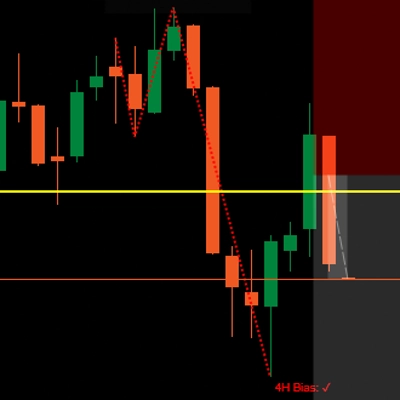
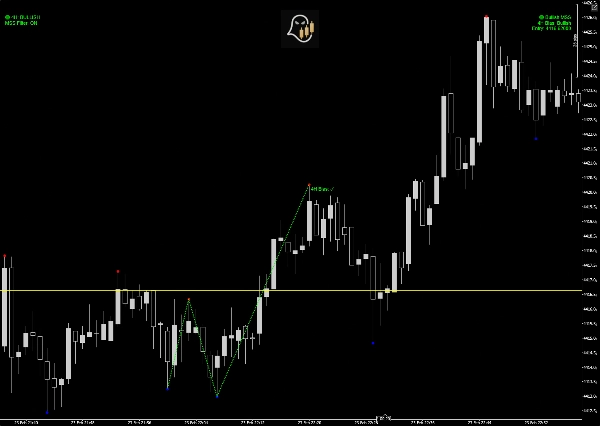
PENAPIS BIAS 4-JAM
Apabila diaktifkan, penunjuk menapis isyarat menggunakan lilin 4H sebelumnya.
- Lilin 4H menaik → hanya MSS menaik dipaparkan
- Lilin 4H menurun → hanya MSS menurun dipaparkan
Ini mengelakkan perdagangan bertentangan dengan momentum jangka masa lebih tinggi.
Bias dikemas kini secara automatik setiap beberapa minit dan dipaparkan pada carta.
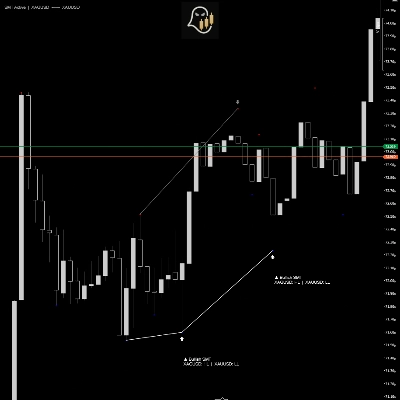
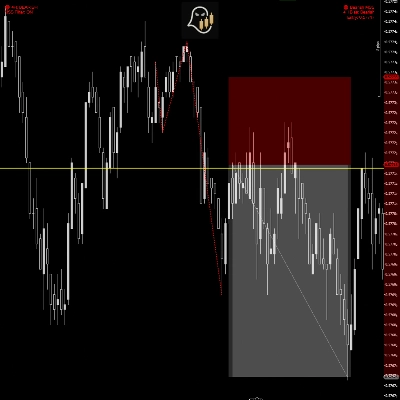
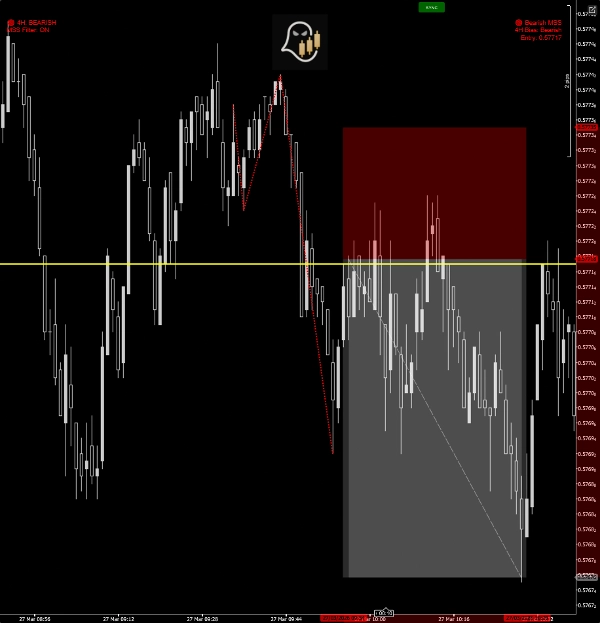
TAHAP KEMASUKAN FIBONACCI
Selepas mengesan MSS, penunjuk mengira:
Penarikan semula 50% antara dua titik ayunan terakhir
Tahap ini mewakili:
- Zon kemasukan semula institusi
- Kawasan pullback optimum
- Harga kemasukan yang cekap risiko
Tahap ini dilukis sebagai garis mendatar.
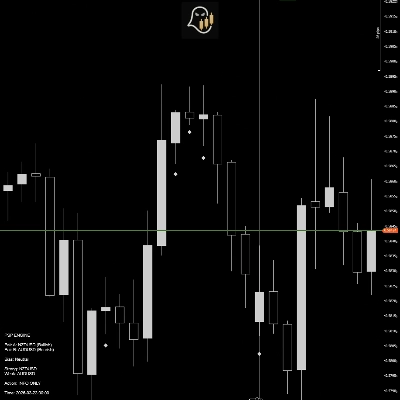
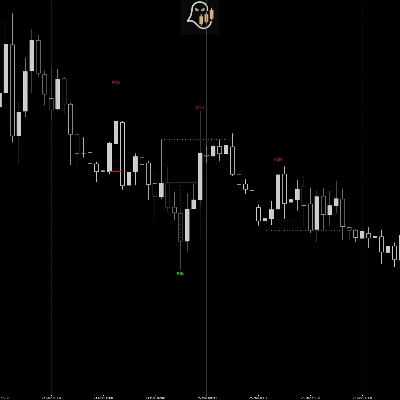
OUTPUT VISUAL
Apabila corak terbentuk, penunjuk memaparkan:
✔ Garis corak
Menyambungkan titik ayunan secara visual
✔ Tahap Fibonacci 50%
Zon kemasukan diserlahkan pada carta
✔ Panel paparan bias
Memaparkan bias arah 4H semasa
✔ Panel amaran MSS
Memaparkan isyarat aktif dan tahap kemasukan
✔ Amaran bunyi (pilihan)
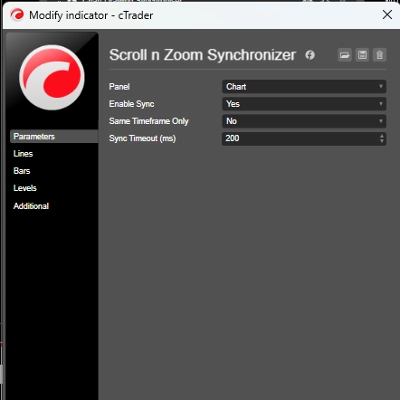
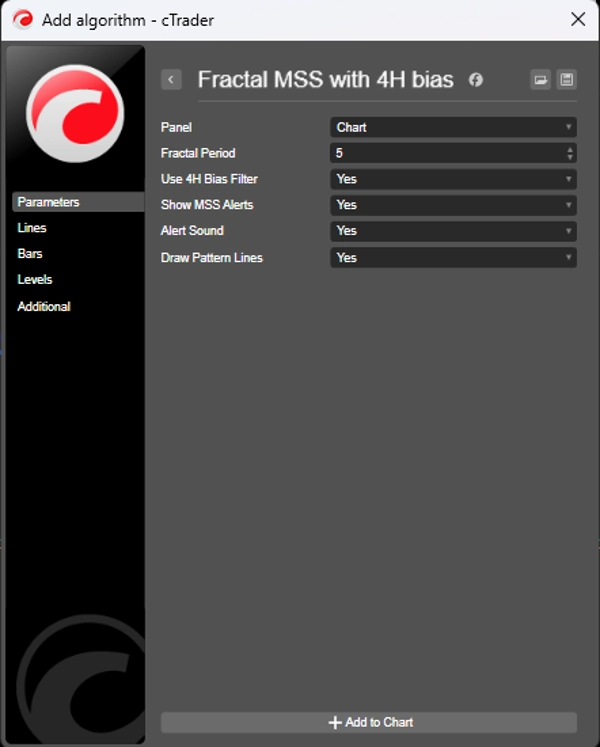
PARAMETER INPUT
Tempoh Fraktal
Mengawal kepekaan ayunan.
- Nilai lebih rendah → lebih banyak isyarat
- Nilai lebih tinggi → hanya ayunan yang lebih kuat
Gunakan Penapis Bias 4H
Menapis isyarat berdasarkan jangka masa lebih tinggi.
Disyorkan: HIDUP
Paparkan Amaran MSS
Memaparkan teks isyarat pada carta.
Bunyi Amaran
Memainkan pemberitahuan apabila MSS terbentuk.
Lukis Garis Corak
Memaparkan struktur visual pada carta.
Nyahaktif jika anda hanya mahukan amaran.
CARA BERDAGANG DENGAN PENUNJUK
Langkah 1
Tunggu pengesanan MSS.
Langkah 2
Sahkan penjajaran bias.
Langkah 3
Tandakan tahap Fibonacci 50%.
Langkah 4
Tunggu harga untuk menarik balik ke zon.
Langkah 5
Masuk mengikut arah MSS.
Ringkasan
Ulasan pelanggan
5 | 50 % | |
4 | 50 % | |
3 | 0 % | |
2 | 0 % | |
1 | 0 % |