
Penerangan
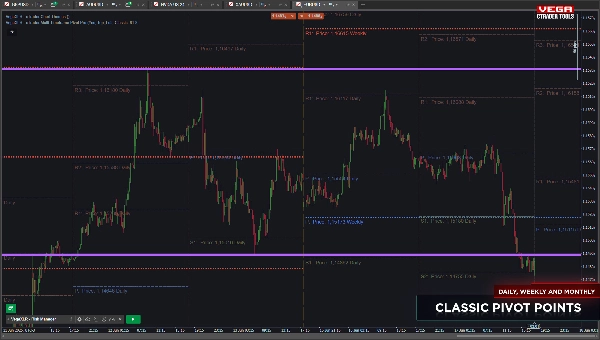
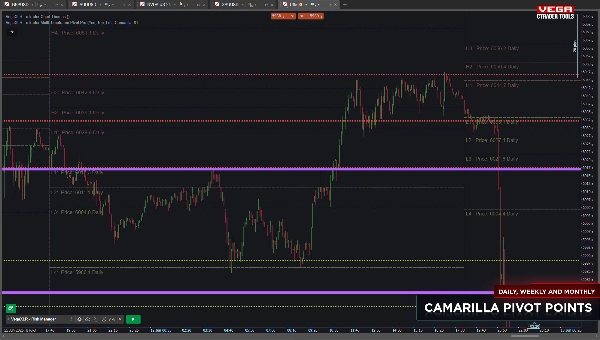
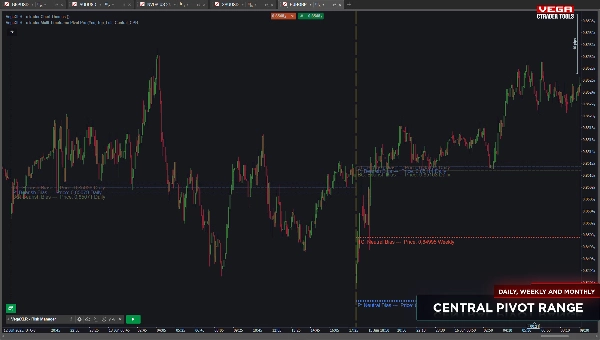
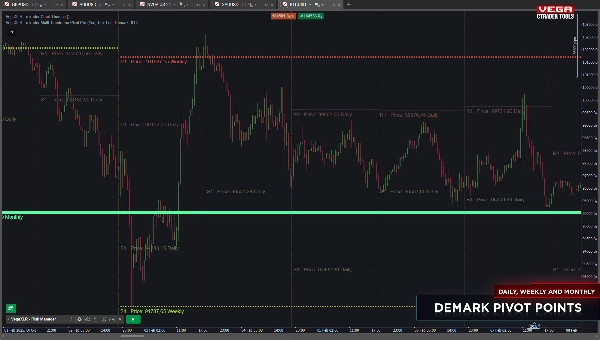
The cTrader Multi-Timeframe Pivot Pro ialah penunjuk titik pivot yang sangat boleh disesuaikan dan kaya dengan ciri untuk cTrader. Ia membolehkan anda memaparkan titik pivot untuk sehingga tiga jangka masa pilihan anda, memilih dari mana-mana jangka masa yang tersedia di platform. Penunjuk ini menyokong pelbagai gaya pivot, termasuk Classic, Fibonacci, Demark, Camarilla, dan Central Pivot Range (CPR), menjadikannya sesuai untuk pelbagai strategi perdagangan.
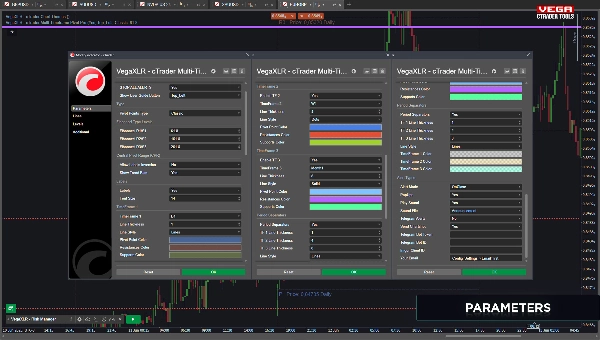
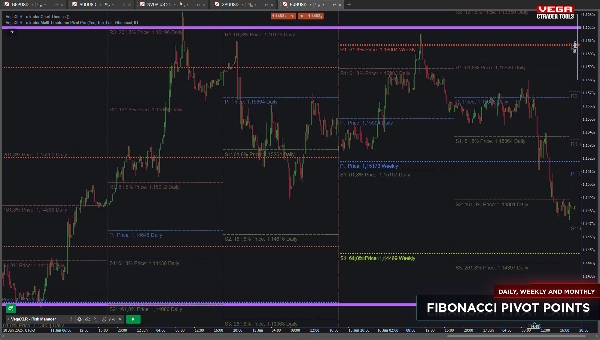
Anda boleh menyesuaikan sepenuhnya label, saiz fon, warna, dan tahap pivot untuk semua jangka masa. Untuk pivot Fibonacci, anda boleh memilih sehingga tiga tahap (lalai: 61.8, 161.8, 261.8) bersama dengan tahap pivot pusat tetap 0%. Mod CPR menawarkan pilihan seperti label bias trend dan tetapan songsang untuk fungsi tambahan.
Ciri tambahan termasuk pemisah tempoh untuk menandakan tempoh perdagangan dengan jelas dan amaran masa nyata apabila harga berinteraksi dengan tahap pivot. Amaran boleh dihantar melalui pop-up cTrader, Telegram (dengan tangkapan skrin carta pilihan), atau e-mel, memastikan anda tidak terlepas pergerakan harga penting.
Penunjuk ini sesuai untuk pedagang yang mencari ketepatan, fleksibiliti, dan alat canggih untuk meningkatkan analisis teknikal mereka.
Berikut adalah senarai ciri lengkap untuk cTrader Multi-Timeframe Pivot Pro penunjuk:
- Sokongan Multi-Jangka Masa:
-
- Memaparkan titik pivot untuk sehingga tiga jangka masa yang boleh disesuaikan.
- Pilih dari mana-mana jangka masa yang tersedia di platform cTrader.
- Pelbagai Gaya Pivot:
-
- Classic
- Fibonacci (dengan sehingga tiga tahap: lalai 61.8, 161.8, 261.8)
- Demark
- Camarilla
- Central Pivot Range (CPR) dengan label bias trend dan tetapan songsang.
- Penampilan Boleh Disesuaikan:
-
- Warna label dan saiz fon yang boleh diselaraskan sepenuhnya.
- Tahap dan gaya pivot yang boleh disesuaikan untuk setiap jangka masa.
- Amaran Masa Nyata:
-
- Amaran dicetuskan apabila harga berinteraksi dengan mana-mana tahap pivot.
- Pemberitahuan melalui pop-up cTrader.
- Amaran Telegram dengan tangkapan skrin carta.
- Pemberitahuan e-mel.
- Pemisah Tempoh:
-
- Menandakan dengan jelas permulaan dan akhir tempoh perdagangan pada carta.
- Analisis Perdagangan Dipertingkatkan:
-
- Menyediakan tahap harga utama untuk keputusan perdagangan yang lebih baik.
- Menyokong pelbagai strategi perdagangan dengan gaya pivot yang fleksibel.
Ciri-ciri ini menjadikan cTrader Multi-Timeframe Pivot Pro alat yang serba boleh dan berkuasa untuk pedagang yang ingin meningkatkan analisis teknikal dan ketepatan perdagangan mereka.
Ringkasan
Ulasan pelanggan
5 | 100 % | |
4 | 0 % | |
3 | 0 % | |
2 | 0 % | |
1 | 0 % |


![Logo "[Hamster-Coder] Bollinger Bands"](https://cdn.ctrader.com/image/webp/21d8e5d6-fb11-4bac-b9ee-cd05c2b76804_30327)


