
Açıklama
ICT Killzones Tamamlandı – Profesyonel Ticaret Oturumu Analizi
cTrader için en kapsamlı ICT Killzones göstergesi ile kurumsal ticaret zamanlamasında ustalaşın. Bu profesyonel araç, beş kritik ICT (Inner Circle Trader) ticaret oturumunun tümünü otomatik olarak tanımlar ve görselleştirir, size akıllı parayla birlikte ticaret yapma avantajı sağlar.
Bu Sürümde Yenilikler:
- Tüm 5 ICT Oturumu: Asya Aralığı, Londra Kill Zone, New York Kill Zone, NY Öğle/Tersine Dönüş Bölgesi ve NY PM Kill Zone dahil tam kapsam
- Akıllı Renk Sistemi: Karmaşık ARGB kodları yerine basit renk isimleri (Kırmızı, Mavi, Turuncu)
- Bağımsız Şeffaflık Kontrolleri: Her oturum için opaklık ayarı (0-100%)
- Oturumlara Özel Etiket Renkleri: Etiket renklerini bölge renklerinden bağımsız olarak özelleştirin
- Oturum Açıklamaları: Her oturumun özelliklerini açıklayan isteğe bağlı bilgi etiketleri
- Geliştirilmiş Performans: Eski bölgelerin otomatik temizliği ile optimize edilmiş kod
Ana Özellikler:
📊 Tam Oturum Kapsamı:
- Asya Aralığı (19:00-00:00 NY): Konsolidasyon bölgelerini ve sonraki baskınlar için likidite havuzlarını tanımlar
- Londra Kill Zone (02:00-05:00 NY): Stop avları ve dönüşler için ideal büyük volatilite sıçramalarını işaretler
- NY Kill Zone (07:00-10:00 NY): Güçlü momentumla ikinci büyük hareketi vurgular
- NY Öğle Bölgesi (12:00-13:30 NY): Dönüş ve konsolidasyon dönemlerini gösterir
- NY PM Kill Zone (13:30-16:00 NY): İkincil hareketleri ve piyasa yeniden dengelenmesini yakalar
🎨 Kolay Renk Özelleştirme:
- Basit renk isimleri: sadece "Mavi", "Turuncu", "Mor" vb. yazın
- DodgerBlue, BlueViolet, MediumAquamarine dahil 50+ ön tanımlı renk
- Hex renk desteği (#RRGGBB formatı)
- Her bölge için bireysel şeffaflık kaydırıcıları (0-100%)
- Maksimum netlik için ayrı etiket renkleri
⚙️ Güçlü Görüntüleme Seçenekleri:
- Bireysel oturumları açıp kapatın
- Oturum bilgi etiketlerini göster/gizle
- Ayarlanabilir yazı tipi boyutu (6-20)
- Bölgeleri grafik kenarına uzatın veya sınırlandırın
- Görüntülenecek geçmiş gün sayısını kontrol edin (1-30 gün)
- Otomatik temizlik grafik karmaşasını önler
🎯 Profesyonel Tasarım:
- Temiz, müdahale etmeyen görselleştirme
- Aktif oturumlar sırasında dinamik yüksek/düşük takibi
- Gece oturumlarının doğru yönetimi
- Tüm zaman dilimlerinde çalışır
- Sıfır gecikme, optimize edilmiş performans
İdeal Kullanım Alanları:
- Kesin zamanlama arayan ICT metodolojisi tüccarları
- Kurumsal akışları takip eden akıllı para tüccarları
- Tam oturum sınırlarına ihtiyaç duyan günlük ve scalper tüccarlar
- Ana dönüş bölgelerini belirleyen swing tüccarları
- Ticaretlerini büyük piyasa oturumlarıyla hizalamak isteyen herkes
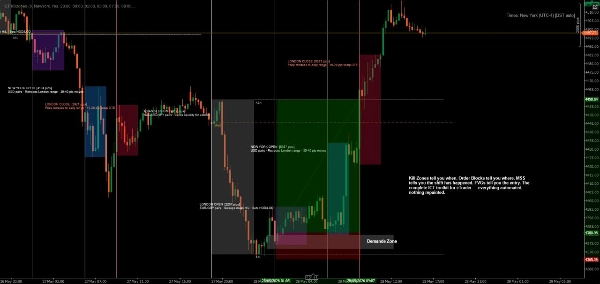
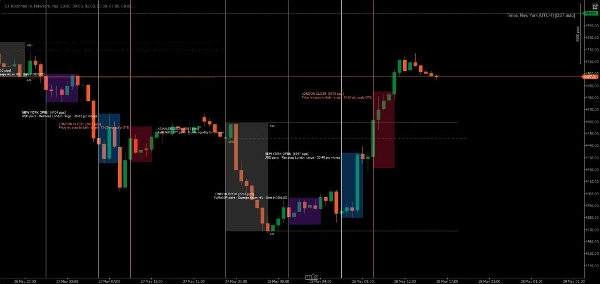
Nasıl Çalışır:
Gösterge her ticaret gününü otomatik olarak algılar ve beş ICT oturumu için renk kodlu bölgeler oluşturur. Fiyat her oturumda hareket ettikçe, gösterge yüksek ve düşük seviyeleri takip eder, oturum kapandığında son bölgeyi çizer. Etiketler her oturumu net şekilde tanımlar ve isteğe bağlı olarak ticaret özelliklerini gösterir.
Tüm zamanlar New York (Doğu) saatindedir, standart ICT metodolojisine uygun olarak.
Özelleştirme Örnekleri:
- Muhafazakar Kurulum: Düşük şeffaflık (20-30%), hafif renkler, oturum bilgisi yok
- Cesur Kurulum: Yüksek şeffaflık (70-80%), canlı renkler, tam oturum açıklamaları
- Minimal Kurulum: İstenmeyen oturumları kapatın, sadece tercih ettiğiniz killzone'ları tutun
- Renk Kodlu Strateji: Bölge renklerini ticaret eğiliminize göre eşleştirin (yeşil = uzun, kırmızı = kısa)
Sistem Gereksinimleri:
- Platform: cTrader Desktop (cTrader Store ürünleri Web veya Mobil sürümlerde desteklenmez) blog.ctrader.com
- İşletim Sistemi: Windows 7 veya üzeri
- İşlemci: Çift çekirdekli CPU önerilir
- Bellek: En az 2 GB RAM (4 GB önerilir)
- İnternet Bağlantısı: Saniyede 50 kB veya daha hızlı
Kurulum Talimatları:
- Satın Al/Yükle: Göstergeleri cTrader Store'dan edinin
- cTrader Desktop İndir: Henüz yüklemediyseniz, ctrader.com adresinden indirin
- Giriş Yap: cTrader Desktop'u açın ve cTrader ID'nizle giriş yapın
- Göstergeye Erişin: "Algo" bölümüne → "Indicators" listesine gidin
- Grafiğe Ekle: Herhangi bir grafiğe sağ tıklayın → "Indicators" → "ICT Killzones Complete" seçin
- Özelleştir: Grafikte gösterge adına sağ tıklayın → "Settings" ile renkleri, zamanları ve görüntüleme seçeneklerini ayarlayın
En İyi Sonuçlar İçin İpuçları:
- Optimal görünürlük için 1 dakikadan 1 saate kadar zaman dilimlerinde kullanın
- En iyi sonuçlar için fiyat hareketi ve likidite kavramlarıyla birleştirin
- Broker farklı zaman dilimleri kullanıyorsa oturum saatlerini ayarlayın
- Mükemmel görsel dengeyi bulmak için şeffaflığı deneyin
- Öğrenirken oturum bilgi etiketlerini etkinleştirin, daha temiz grafikler için devre dışı bırakın
Hassasiyetle Ticaret Yapın. Güvenle Ticaret Yapın. ICT Yöntemiyle Ticaret Yapın.
Not: Bu gösterge eğitim ve bilgilendirme amaçlıdır. Geçmiş performans gelecekteki sonuçları garanti etmez. Her zaman uygun risk yönetimi uygulayın.
Özet
The indicator tracks high and low prices during active sessions and finalizes zones upon session close, providing clear visual boundaries for institutional trading timing. It supports all timeframes, handles overnight sessions properly, and includes automatic cleanup of old zones to maintain chart clarity. Customization options include font size adjustment, zone extension control, and history length for displayed zones. ICT Killzones Complete is suitable for traders using ICT methodology, smart money concepts, scalping, day trading, and swing trading across markets such as Forex, commodities, and crypto. It requires cTrader Desktop on Windows 7 or higher with recommended hardware specifications.
Müşteri değerlendirmeleri
5 | 50 % | |
4 | 25 % | |
3 | 0 % | |
2 | 25 % | |
1 | 0 % |


