
Açıklama
SmartFibonacci — Daha hızlı ve daha emin ticaret kararları için otomatik, yapılandırılabilir Fibonacci geri çekilmeleri ve uzantıları, daha yüksek zaman dilimi desteği, fiyat etiketleri ve yakınlık uyarıları.
Mağaza için hazır kısa açıklama (1–2 satır)
SmartFibonacci, otomatik olarak salınım yüksek/düşük noktalarını algılar ve grafiğinizde net Fibonacci geri çekilmeleri ve isteğe bağlı uzantılar çizer. Yapılandırılabilir geriye dönük bakış, daha yüksek zaman dilimi salınım algılama, etiketli fiyatlar/yüzdeler ve yakınlık uyarıları, hem günlük scalping hem de salınım kurulumları için idealdir.
Tam ürün açıklaması (cTrader Mağazası için kopyala-yapıştır hazır)
SmartFibonacci, Fibonacci analizini otomatikleştiren hafif ve performans odaklı bir cTrader göstergesidir, böylece seviyeleri çizmek için daha az, ticaret yapmak için daha fazla zaman harcayabilirsiniz. Yapılandırılabilir geriye dönük bakış içinde en son salınım yüksek ve düşük noktalarını bulur, geri çekilme seviyeleri ve isteğe bağlı projeksiyon (uzantı) seviyeleri çizer ve hızlı yorumlama için fiyat ve yüzde etiketleri gösterir. Sağlam sinyaller için SmartFibonacci, seviyeleri mevcut grafikte çizerken daha yüksek bir zaman diliminde salınım noktalarını hesaplayabilir. Yerleşik uyarılar (açılır pencere + ses) fiyat herhangi bir görünür Fibonacci seviyesine yapılandırılabilir pip mesafesi içinde geldiğinde sizi bilgilendirir.
Bu liste şunları içerir: ana kullanıcı arayüzü öğelerini gösteren net ekran görüntüleri, örnek iş akışları, yapılandırma ayarları ve alıcıların satın almadan önce işlevselliği ve kullanıcı deneyimini kolayca değerlendirmesi için örnek çıktılar (fiyat etiketleri, uzantılar, uyarılar).
Ana özellikler
- Otomatik salınım algılama — yapılandırılabilir geriye dönük pencere içinde en son salınım yüksek/düşük noktalarını bulur.
- Daha yüksek zaman dilimi salınım seçeneği — daha düzgün ve anlamlı seviyeler için daha yüksek zaman diliminde salınım pivotlarını hesaplar.
- Geri çekilmeler ve Uzantılar — standart geri çekilme çizgileri ve isteğe bağlı projeksiyon (uzantı) seviyeleri çizer (kullanıcı tanımlı yüzdeler, örn. 127.2, 161.8 vb.).
- Fiyat ve yüzde etiketleri — her görünür seviye hızlı karar vermek için yüzde ve kesin fiyatını gösterir.
- Özelleştirilebilir görseller — renkleri (geri çekilme / uzantı), çizgi kalınlığını ve çizgi stilini ayarlayın.
- Yakınlık uyarıları — fiyat görünür bir Fibonacci seviyesine yapılandırılabilir pip yarıçapı içinde girdiğinde açılır pencere + ses; sadece en yakın seviyeyi uyarmayı seçme seçeneği.
- Verimli yeniden çizim mantığı — gösterge, grafik karmaşasını ve CPU kullanımını azaltmak için sadece salınım pivotları değiştiğinde yeniden çizer.
- Güvenli varsayılanlar — kurulum sonrası hemen kullanmak isteyen traderlar için mantıklı varsayılanlar.
- cTrader / cAlgo ile uyumlu — üst üste binen gösterge olarak çalışacak şekilde tasarlanmıştır.
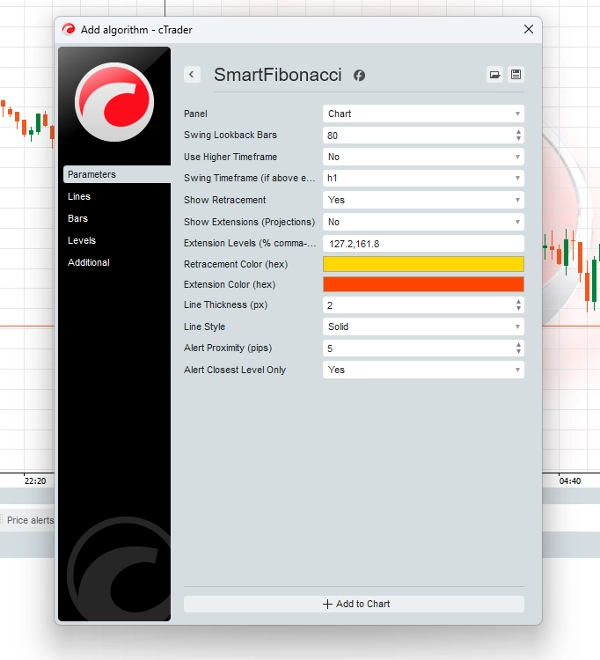
Yapılandırma (parametreler ve açıklamalar)
- Salınım Geriye Dönük Çubuklar (int) — salınım yüksek/düşük bulmak için geriye kaç çubuk aranacağı (varsayılan 80).
- Daha Yüksek Zaman Dilimi Kullan (bool) — mevcut grafikte çizerken daha yüksek bir zaman diliminde algılamayı etkinleştirir.
- Salınım Zaman Dilimi (TimeFrame) —
Daha Yüksek Zaman Dilimi Kullanetkinleştirildiğinde kullanılacak daha yüksek zaman dilimi. - Geri Çekilmeyi Göster (bool) — geri çekilme seviyelerinin çizimini aç/kapa.
- Uzantıları Göster (bool) — uzantı/projeksiyon seviyelerinin çizimini aç/kapa.
- Uzantı Seviyeleri (string) — virgülle ayrılmış yüzde değerleri (örneğin,
127.2,161.8) projeksiyon çizgilerini doldurmak için kullanılır. - Geri Çekilme Rengi / Uzantı Rengi (hex) — geri çekilme ve uzantı çizgileri için renk seçin.
- Çizgi Kalınlığı (px) — tam sayı çizgi kalınlığı ayarı.
- Çizgi Stili (enum) — düz, kesikli vb. seçin.
- Uyarı Yakınlığı (pip) — yakınlık uyarıları için pip cinsinden mesafe.
- Sadece En Yakın Seviyeyi Uyar (bool) — etkinleştirildiğinde, sadece en yakın fib seviyesi açılır pencereyi tetikler.
Analitik çıktılar ve kullanıcı deneyimi öğeleri
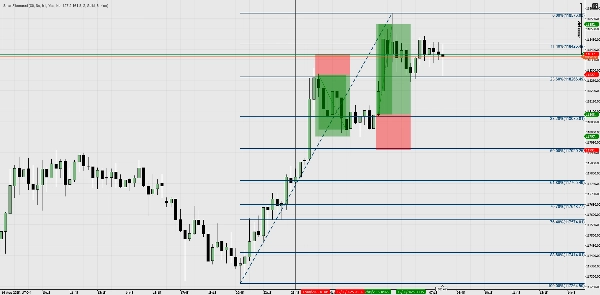
- Grafikte çizgiler — net yüzde etiketleri (örneğin, %61.8) ve fiyat etiketleri (örneğin, 1.23456) ile geri çekilme ve uzantı çizgileri.
- Açılır bildirimler — kullanıcı, fiyat
Uyarı Yakınlığıalanına girdiğinde ekranda açılır pencere ve sistem sesi alır. - Rahatsız etmeyen yeniden çizimler — algılanan salınım değiştiğinde güncellenir, sık yeniden çizim titremesini önler.
- Fiyat kaynağı tutarlılığı — uyarılar ve etiketler, fib'in çizildiği aynı Çubuk serisi kullanılarak hesaplanır (daha yüksek zaman dilimi hesaplaması kullanılırken önemlidir).
Örnek iş akışları / kullanım senaryoları
- Hızlı kurulum (scalping / günlük)
-
- SmartFibonacci'yi 5 dakikalık bir grafiğe ekleyin,
Lookback = 80,ShowRetrace = trueolarak ayarlayın. - Geri çekilme seviyelerini izleyin ve %61.8 / %50'yi günlük tepki bölgeleri olarak kullanın.
- Önemli seviyelere yaklaşıldığında bildirim almak için
Uyarı Yakınlığı = 5 pipetkinleştirin.
- SmartFibonacci'yi 5 dakikalık bir grafiğe ekleyin,
- Daha yüksek zaman dilimi bağlamı (salınım ticareti)
-
-
Daha Yüksek Zaman Dilimi Kullan = trueolarak ayarlayın veDaha Yüksek Zaman Dilimi = H4(veya Günlük) seçin. - Seviyeler H4 salınımlarını yansıtırken siz H1 veya M30'da işlem yaparsınız — daha yüksek zaman dilimi yapısıyla daha iyi uyum.
- Salınım işlemleri için kar hedefleri olarak uzantıları (127.2, 161.8) kullanın.
-
- Doğrulama + örtüşme
-
- SmartFibonacci seviyelerini mevcut destek/direnç, yapı kırılmaları veya hareketli ortalamalarınızla birleştirerek girişleri doğrulayın.
- Giriş zamanlaması için açılır uyarıları kullanın veya geri test için etkileşimleri kaydedin.
- Uyarı odaklı iş akışları
-
- Birden fazla grafiği izlerken göstergenin açık kalmasını sağlayın; fiyat herhangi bir yapılandırılmış görünür fib seviyesine yaklaştığında açılır pencereler alın ve buna göre hareket edin.
Özet
Müşteri değerlendirmeleri
5 | 100 % | |
4 | 0 % | |
3 | 0 % | |
2 | 0 % | |
1 | 0 % |


!["[Hamster-Coder] Moving Average MTF" logosu](https://cdn.ctrader.com/image/webp/b11b98b1-194d-4b8e-b00e-d611826ad159_31226)


