
Açıklama
🏆 10.000+ Tüccar 25+ Algoritma Paketimize Güveniyor! 🏆
Piyasa Yapısı ve Likiditeden akıllı çıkış sistemleri ve öngörü araçlarına kadar - tutarlı işlem için ihtiyacınız olan HER aracı geliştirdik.
👉 Tüm 25+ KANITLANMIŞ Sisteme Erişin:
_______________________________________________
📌 Piyasa Yapısı Göstergeleri
· ✅ Gelişmiş Piyasa Yapısı: Bos, Choch, SwinLevels, Emir Blokları, Piyasa Yapısı& Likidite Bulucu
· 🔄 Dinamik Piyasa Yapısı Dönüş Noktalarının Analizi
· 🧱 Emir Bloğu
· ⚖️ Piyasa Dengesizliği
· ⛓️ BOS & CHOCH
· 🧠 ICT 3 Gücü
_______________________________________________
🔚 Akıllı Çıkış Sistemleri
· 📍 Takip Eden Akıllı Algoritma
_______________________________________________
📐 ZigZag Göstergeleri
· 🔍 ZigZag Fiyat Likidite Projeksiyonu
· ➖ ZigZag
· 🎯 Zig-Zag Uç Nokta Takipçisi
_______________________________________________
🧱 Destek ve Direnç Göstergeleri
· 🟩 Akıllı Trend Destek ve Direnç Çizgileri
· 🧱 Tüm Destek ve Direnç Seviyeleri
_______________________________________________
📊 Trend ve Kanal Göstergeleri
· 📊 Süpertrend
· 🧠 Uyarlanabilir Trend Kanalı
· 🔁 Reaktif Hareketli Ortalama
_______________________________________________
💧 Hacim ve Likidite Araçları
· 🔍 Momentum Adil Değer Boşluğu
· 🕒 Adil Değer Boşluğu Seansları
_______________________________________________
⚡ Momentum ve RSI Göstergeleri
· 🔎 Çok Katmanlı Mum Eğilimi
Takipçisi
_______________________________________________
🔮 Tahmin ve Projeksiyon Araçları
· 📐 Linreg ve ATR'ye Dayalı Tahmin
· 📏 Fibonacci Doğrusal Regresyon Çok Zamanlı Çerçeve
· 📈 Hacim Destekli Piyasa Akışı Projeksiyonu_________________________
_________________________________________________________________________________________________
_________________________________________________________________________________________________
ZigZag Yapı Pro – 🚀
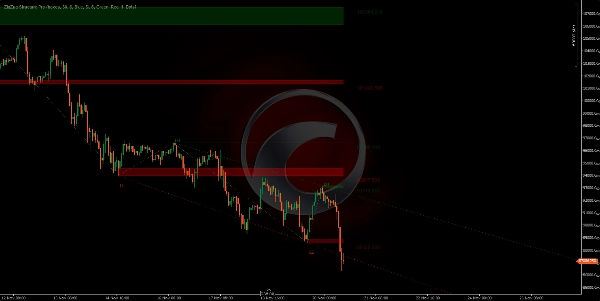
Piyasanın önemli dönüş noktalarını otomatik olarak tanımlar (ana yüksekler ve düşükler) ve gerçek zamanlı güncellenen dinamik destek ve direnç bölgeleri çizer. 🎯 Geleneksel statik seviyelerin aksine, bu gösterge fiyat yapısındaki değişikliklere sürekli uyum sağlar.
Ne için kullanılır? ❓
Bu gösterge, profesyonel bir teknik analiz aracı olarak tasarlanmıştır:
- Kurumsal seviyeleri tanımlamak: 🏛️ Fiyatın önemli yüksek ve düşük yapılar oluşturduğu noktaları otomatik olarak algılar.
- Piyasa yapısı analizi: 📊 Her hareketi boğa/ayı yapısı metodolojisine göre sınıflandırır (Daha Yüksek Yüksekler, Daha Düşük Düşükler vb.).
- Trend projeksiyonu: 🔮 Trend çizgilerini geleceğe uzatarak potansiyel fiyat tepki bölgelerini tahmin eder.
- Ters ve devam eden işlemler: 💰 İşaretlenen seviyeler giriş, stop-loss ve kar hedefleri için referans olarak kullanılır.
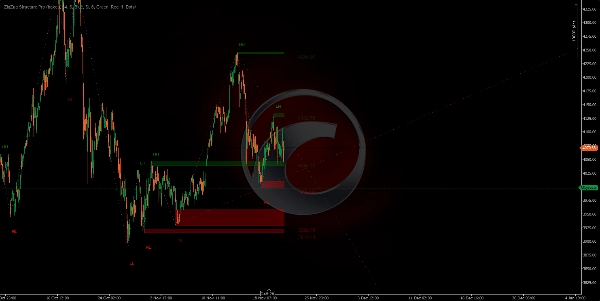
Gösterge grafiğinizde şunları çizer: ✍️
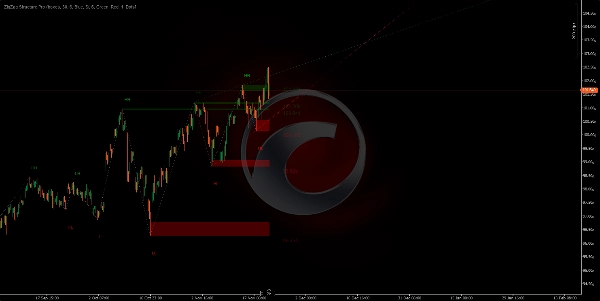
1. Destek/Direnç Bölgeleri (Dikdörtgenler)
- Yeşil bölgeler: 🟢 Destek alanlarını işaretler (fiyatın sıçrayabileceği önemli dipler).
- Kırmızı bölgeler: 🔴 Direnç alanlarını işaretler (fiyatın geri çekilebileceği önemli tepeler).
- Bu bölgeler ileriye projekte edilir ve mevcut aktif seviyeleri gösterir.
- Her bölgenin kalınlığı pivotun oluştuğu mum gövdesini temsil eder.
https://chartshots.spotware.com/c/691f5a4d75ac4
https://chartshots.spotware.com/c/691f6b4f2e98b
https://chartshots.spotware.com/c/691f6c6fda808
https://chartshots.spotware.com/c/691f6d0aa6155
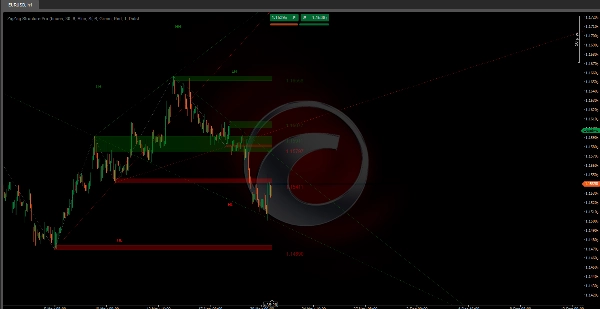
2. Bağlantı Çizgileri ⚡
- Her pivotu bir sonrakine bağlayarak görsel bir "zigzag" deseni oluşturur.
- Piyasa gürültüsünü ortadan kaldırır, sadece gerçekten önemli hareketleri gösterir.
- Trendin yönünü ve yapısını bir bakışta görmeyi kolaylaştırır.
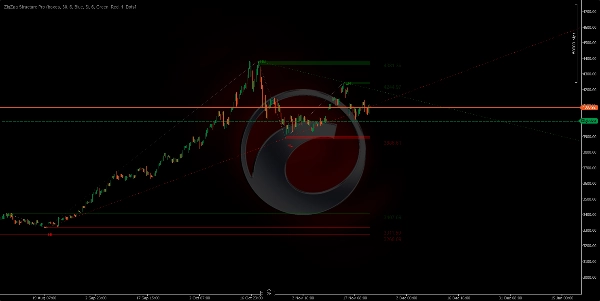
3. Projeksiyonlu Trend Çizgileri (Uzatılmış Yeşil/Kırmızı)
- Önceki pivottan mevcut pivota çizilir ve geleceğe doğru uzatılır.
- Yeşil: 🟢 Boğa trend çizgileri (diplerden).
- Kırmızı: 🔴 Ayı trend çizgileri (tepelerden).
- En son ve aktif 2 trend çizgisini gösterir.
- Trend kırılmaları veya saygılarını tespit etmek için faydalıdır.
4. Piyasa Yapısı Etiketleri 🏷️
Her pivot, sınıflandırmasını gösteren bir etiket gösterir:
- HH (Daha Yüksek Yüksek): ↗️ Daha Yüksek Yüksek - Boğa devamı.
- LH (Daha Düşük Yüksek): ⬆️ Daha Düşük Yüksek - Olası ayı dönüşü.
- HL (Daha Yüksek Düşük): ⬇️ Daha Yüksek Düşük - Olası boğa dönüşü.
- LL (Daha Düşük Düşük): ↘️ Daha Düşük Düşük - Ayı devamı.
Algoritmanın mantığı 🧠
Gösterge, uyarlanabilir bir zigzag algoritması kullanır:
- Fiyatı, yapılandırılabilir bir dönem içinde yüksekler ve düşükler arar (varsayılan 34 bar).
- Önemsiz hareketleri filtreler minimum sapma eşiğiyle (varsayılan 6 pip).
- Her pivotu doğrular piyasa yapısında gerçek bir değişikliği temsil ettiğinden emin olur.
- Ardışık pivotlar arasındaki yapıları karşılaştırarak hareket türünü sınıflandırır.
- Bölgeleri dinamik olarak günceller yeni pivotlar ortaya çıktıkça en eski olanları kaldırır.
Ana Ayarlar ⚙️
- Pivot Geriye Bakış Barları: Pivot algılayıcının hassasiyetini kontrol eder (düşük = daha fazla pivot, yüksek = sadece büyük pivotlar).
- Fiyat Sapma Filtresi: Gürültü filtresi - bu değerden küçük hareketler göz ardı edilir.
- Maksimum Görünen Bölgeler: Görünür kalan tarihsel seviyelerin sayısı (1 ila 20 arasında).
- Bölge Görüntüleme Türü: Dikdörtgenler (tam bölgeler) veya basit çizgiler arasında seçim yapın.
- Uzatılmış Trend Çizgilerini Göster: Trend projeksiyonlarını etkinleştir/devre dışı bırak.
Hızlı Parametre Kılavuzu 📖
Pivot Geriye Bakış Barları (Varsayılan: 30)
- ↑ Artır (40-100): DAHA AZ pivot, daha önemli. swing trading için.
- ↓ Azalt (15-25): DAHA FAZLA pivot, daha fazla sinyal. scalping/gün içi işlem için.
Fiyat Sapma Filtresi (Varsayılan: 6)
- ↑ Artır (8-15): Gürültüyü filtreler, sadece büyük hareketler. Daha az sinyal, daha yüksek kalite.
- ↓ Azalt (2-5): Daha hassas, küçük hareketleri yakalar. Daha fazla sinyal.
Maksimum Görünen Bölgeler (Varsayılan: 6)
- ↑ Artır (10-20): Daha fazla tarihsel seviye görünür. Derin analiz için.
- ↓ Azalt (2-4): Sadece son seviyeler. Temiz grafik.
Tarihsel Pivot Limiti (Varsayılan: 200)
- ↑ Artır (300-500): Hesaplamalar için daha fazla geçmiş. Uzun vadeli analiz.
- ↓ Azalt (50-150): Sadece güncel yapı. Daha iyi performans.
Aktif Projeksiyon Sayısı (Varsayılan: 5)
- ↑ Artır (5-10): Daha fazla projeksiyonlu trend çizgisi.
- ↓ Azalt (1-2): Sadece baskın trendler. Daha fazla netlik.
Uzatılmış Trend Çizgilerini Göster (Evet/Hayır)
- Etkin: Trendleri geleceğe projekte eder.
- Devre Dışı: Sadece tarihsel zigzag.
🎯 Hızlı Ayarlar
- Scalping: Geriye Bakış 15-20 | Sapma 3-5 | Bölgeler 3-4
- Gün İçi İşlem: Geriye Bakış 25-35 | Sapma 6-8 | Bölgeler 5-6
- Swing Trading: Geriye Bakış 40-60 | Sapma 10-15 | Bölgeler 8-12
Özet
Müşteri değerlendirmeleri
5 | 0 % | |
4 | 100 % | |
3 | 0 % | |
2 | 0 % | |
1 | 0 % |


!["[Hamster-Coder] Bollinger Bands" logosu](https://cdn.ctrader.com/image/webp/21d8e5d6-fb11-4bac-b9ee-cd05c2b76804_30327)

