
Açıklama
“İlk Aralık” göstergesi nedir?
Bu gösterge, Pine Script “Opening Range Breakout” aracının bir portudur.
Aslen adı ORB – Opening Range Breakout idi: bir oturumun ilk dakikalarının fiyat aralığını alırsınız, sonra o aralığın kırılmasını işlem yaparsınız.
Bu versiyonda adını IR – Initial Range olarak değiştirdik, ancak fikir aynı:
- Gösterge birkaç İlk Aralık oluşturur:
-
- IR5 – ilk 5 dakika
- IR15 – ilk 15 dakika
- IR30 – ilk 30 dakika
- IR60 – ilk 60 dakika
- Her IR için şunlara sahipsiniz:
-
- IR Yüksek
- IR Düşük
- IR Orta (aralığın orta noktası)
- Hangi aralıkların aktif olduğunu ve hangi renkleri kullandıklarını seçebilirsiniz.
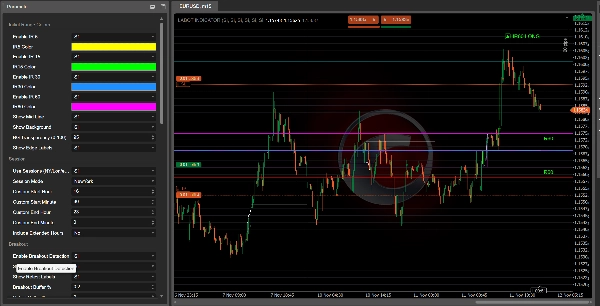
Bir aralık tamamlandığında, gösterge fiyatın bu aralıktan çıkıp çıkmadığını kontrol eder:
- IR Yüksek seviyesinin üzerinde kırılma → IR60 UZUN, IR30 UZUN, vb.
- IR Düşük seviyesinin altında kırılma → IR60 KISA, IR30 KISA, vb.
Bu etiketler grafikte görünür, böylece hangi ilk aralığın sinyal ürettiğini hızlıca görebilirsiniz.
Filtreler ve onaylar
Gösterge, rastgele kırılmaları önlemek için birkaç filtreyi birleştirecek şekilde tasarlanmıştır:
- Trend filtresi
Şunları kullanabilirsiniz: -
- VWAP
- EMA
- Özel EMA uzunluğu
- VWAP + EMA birlikte
Trend yönündeki kırılmalar tercih edilir (örneğin, fiyat VWAP/EMA'nın üzerindeyken sadece UZUN).
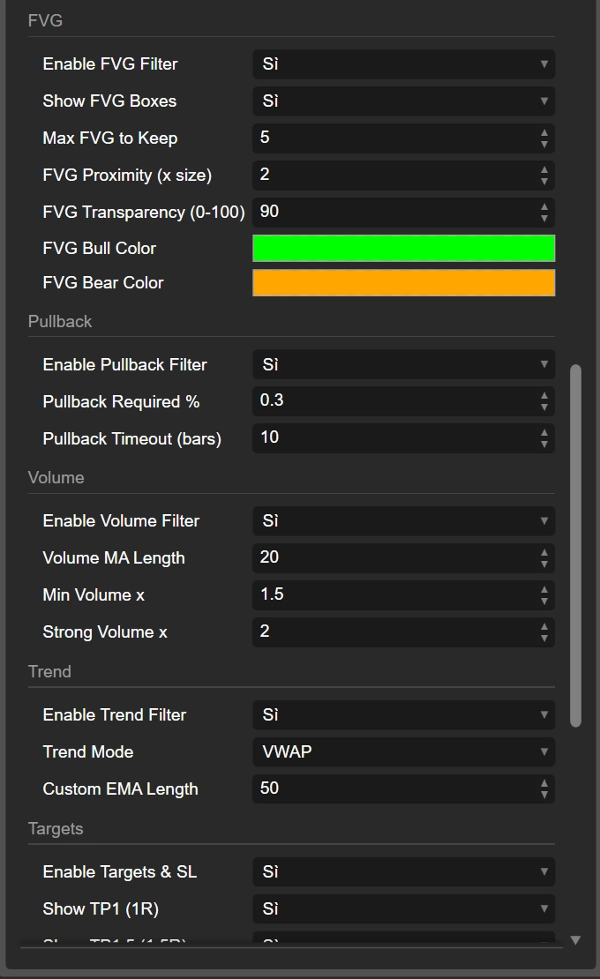
- Hacim filtresi
Gösterge mevcut hacmi, hacmin hareketli ortalaması ile karşılaştırır: -
- “normal” onay
- “güçlü” hacim
İsterseniz zayıf hacimli kırılmalar göz ardı edilebilir.
- FVG (Adil Değer Boşluğu) filtresi
Boğa ve ayı FVG'lerini tespit eder ve kırılmanın ilgili bir FVG yakınında gerçekleşmesini gerektirebilir: -
- IR Yüksek yakınındaki boğa FVG'si UZUN destekler
- IR Düşük yakınındaki ayı FVG'si KISA destekler
- Geri çekilme filtresi
Kırılmadan sonra minimum bir geri çekilme ve bu geri çekilmenin gerçekleşmesi için bir zaman aralığı (bar cinsinden) gerektirebilirsiniz. Bu, devam etmeden önce gerçekten “nefes alan” kırılmalara odaklanmanıza yardımcı olur.
Kırılmalar, retestler ve başarısız kırılmalar
İlk Aralıktan bir kırılmadan sonra, gösterge fiyatın sonraki hareketini izler:
- Aralıktan kaç barın dışarıda kaldığını sayar.
- Fiyatın yeterince uzaklaşıp uzaklaşmadığını kontrol eder (minimum mesafe % olarak).
- Sonra aralığa retest yapılıp yapılmadığını izler.
Şunları görebilirsiniz:
- IR60 UZUN / IR60 KISA (kırılma)
- Retest UZUN / Retest KISA etiketleri, fiyat sağlam bir hareketten sonra geri döndüğünde
- Başarısız UZUN / Başarısız KISA etiketleri, kırılma hızlıca başarısız olduğunda ve fiyat taahhüt olmadan aralığa yeniden girdiğinde
Bu size üç tür bilgi verir:
- temiz kırılma
- retest ile sağlıklı kırılma
- sahte/başarısız kırılma
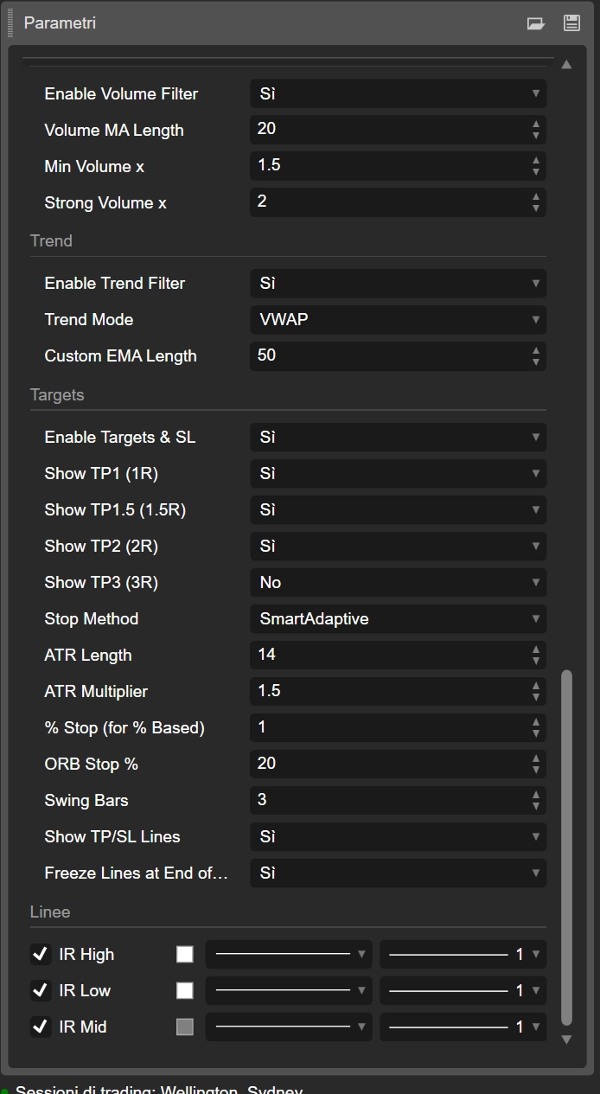
Hedefler, stop loss ve işlem görselleştirmesi
Gösterge ayrıca şunlara dayalı otomatik TP ve SL seviyeleri hesaplar:
- ATR
- IR genişliğinin %'si
- sabit % stoplar
- swing noktaları
- “akıllı” uyarlanabilir ve ölçeklendirilmiş ATR modları
Giriş fiyatı ve stop seviyesi üzerinden birkaç hedef hesaplar:
- TP1 (1R)
- TP1.5 (1.5R)
- TP2 (2R)
- TP3 (3R)
Hangi hedeflerin gösterileceğini seçebilirsiniz.
Çizgiler grafikte çizilir:
- IR_GİRİŞ_UZUN / IR_GİRİŞ_KISA
- IR_SL_UZUN / IR_SL_KISA
- IR_TP1 / IR_TP1.5 / IR_TP2 / IR_TP3
Fiyat bir hedefe veya stopa ulaştığında, durum güncellenir ve çizgiler ayarlarınıza bağlı olarak son TP'den sonra veya gün sonunda “dondurulabilir”.
Kısaca
- Eski isim: ORB (Opening Range Breakout)
- Yeni isim: IR (Initial Range) – aynı konsept, daha temiz isimlendirme
- Erken oturum aralıkları oluşturur (IR5, IR15, IR30, IR60)
- İşaretler UZUN / KISA kırılmaları, retestleri ve başarısız kırılmaları
- Kaliteyi artırmak için trend, hacim, FVG ve geri çekilme filtreleri kullanır
- Giriş, stop ve birden fazla hedefi doğrudan grafikte çizer
Yani grafikte “IR60 UZUN” gördüğünüzde, temelde oturumun ilk 60 dakikasındaki Opening Range Breakout'a bakıyorsunuz – sadece daha modern, özelleştirilebilir bir isim ve arkasında çok fazla ekstra mantık var.
Özet
The indicator marks breakout signals when price moves above the range high (LONG) or below the range low (SHORT), displaying corresponding labels on the chart. It also tracks retests and failed breakouts, distinguishing clean breakouts, healthy retests, and fake moves.
To improve signal quality, the indicator incorporates multiple filters: trend filters using VWAP and EMA, volume filters comparing current volume to averages, Fair Value Gap (FVG) filters detecting bullish or bearish imbalances near breakout levels, and pullback filters requiring minimum retracements after breakouts.
Additionally, it calculates and plots automatic entry, stop loss, and multiple take profit levels based on ATR, percentage of the initial range width, fixed percentages, swing points, and adaptive ATR modes. These visual aids help traders manage risk and targets directly on the chart.
The Initial Range indicator supports various markets including Forex, stocks, indices, commodities, and cryptocurrencies, and is designed to enhance breakout trading strategies with customizable parameters and comprehensive trade visualization.
Müşteri değerlendirmeleri
5 | 100 % | |
4 | 0 % | |
3 | 0 % | |
2 | 0 % | |
1 | 0 % |


