
说明
cTrader的点动量%B动态可视化工具
量化波动性。可视化动量。掌控你的入场时机。
释放波动性的力量,使用布林带%B动态可视化工具,这是为cTrader设计的独特自定义指标,旨在为您提供相对于其波动性包络的价格行为无与伦比的洞察。超越传统布林带,该指标将复杂的波动性指标转化为直观的、颜色编码的圆点流,帮助您识别关键的市场转折点和趋势强度。
什么是布林带%B及其区别?
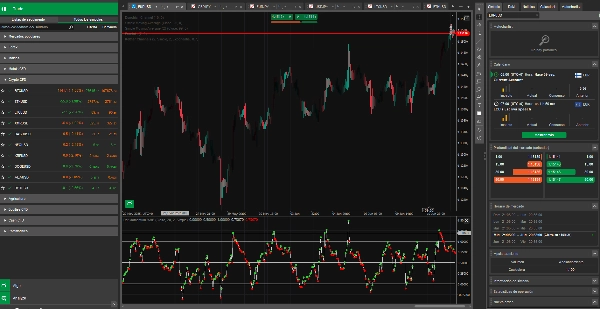
虽然标准布林带直接叠加在价格图表上,显示动态支撑/阻力并通过其扩张和收缩直观地表示市场波动性,布林带%B是一个振荡器。它显示在主图表下方的单独面板中,提供了一个可量化的度量,显示当前价格在布林带包络内的位置。
它不直接显示价格;相反,它揭示了价格在0到1的刻度上的相对位置:
- 0.0:价格位于布林带下轨。
- 0.5:价格位于布林带中轨(移动平均线)。
- 1.0:价格位于布林带上轨。
优势及波动性背景:
该指标不仅仅是观察工具。它量化了价格相对于其固有波动性的位置,使您能够:
- 衡量趋势强度:持续的%B高于0.5表明强劲的上行动能,而低于0.5则表示下行压力。
- 识别潜在反转:极端读数(接近0.0或1.0)可能表明价格在当前波动范围内过度延伸。
- 理解上下文波动性:波动性本身(由基础布林带的宽度表示)始终具有上下文性,取决于您查看的时间框架。1小时图上的%B读数与1天图上的波动性反映不同。我们的指标无缝适应您选择的时间框架,提供相关洞察。
技术特性:
- 精确计算:%B计算公式为:(当前价格−下轨)/(上轨−下轨)
- 动态颜色编码(圆点):
-
- 青柠绿圆点:表示%B值较前一根柱上涨,显示上行动能。
- 红色圆点:表示%B值较前一根柱下降,显示下行动能。
- 银色圆点:当%B值保持不变或为第一个有效点时显示。
- 细微路径线:一条细而浅灰色的线细微地描绘%B值的整体路径,在动态圆点下方提供视觉连续性。
- 低调的水平标记:在0.0、0.5和1.0处的深灰色实线(清晰可见但不会压倒主要可视化)提供波动极值和均值的明确参考点。
- 可定制:可直接从设置中调整布林带周期、标准差和移动平均类型。
简化说明:过度波动信号(类似波动性的RSI!)
把这个指标想象成一个RSI,但针对波动性过度延伸,而非简单的超买/超卖价格水平。
- 当圆点触及或低于0.0时,意味着价格正强力推向其当前波动包络的下沿。这类似于一个“波动性超卖”信号,表明市场可能在其当前背景下向下过度延伸。
- 当圆点触及或高于1.0时,意味着价格正强力推向其当前波动包络的上沿。这类似于一个“波动性超买”信号,表明市场可能在其当前背景下向上过度延伸。
这些极端读数不一定意味着立即“买入”或“卖出”,但它们是强有力的警示,表明市场处于其典型波动范围的极端点,针对特定时间框架。这通常预示着潜在的均值回归或市场波动行为的变化。
摘要
指标配置
客户评价
4.0
评价:2
5 | 0 % | |
4 | 100 % | |
3 | 0 % | |
2 | 0 % | |
1 | 0 % |
客户评价
June 25, 2025
H1 makes the signal less noisy, and it helps keep random trades out of the plan.
June 18, 2025
讨论
常见问答
Signal
Commodities
RSI
Bollinger
cTrader Store 提供的所有产品,包括交易机器人、指标和插件,均由第三方开发者提供,仅供信息参考和技术访问之用。cTrader Store 并非经纪商,不提供投资建议、个人推荐或任何未来业绩保证。


价格
注册日期 10/06/2025
1
销售