
Mô tả
Hồ Sơ Khối Lượng Phiên HD
Nó Là Gì
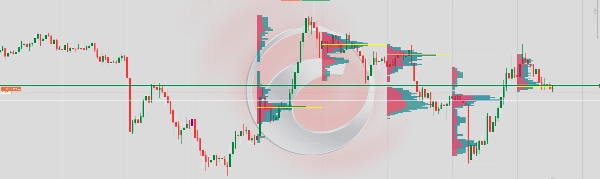
Hiển thị hồ sơ khối lượng ngang cho mỗi phiên giao dịch trực tiếp trên biểu đồ. Nó cho thấy cách khối lượng giao dịch được phân bổ theo các mức giá, giúp các nhà giao dịch xác định các vùng hoạt động cao, khu vực giá trị hợp lý và các mức hỗ trợ/kháng cự chính được xác định hoàn toàn từ hành vi khối lượng.
Cách Hoạt Động
Ở mỗi lần đóng nến mới, chỉ báo quét tất cả các nến trong số phiên đã định và phân phối khối lượng tick của mỗi nến theo phạm vi giá của nó. Khối lượng được chia thành bên mua (nến tăng) và bên bán (nến giảm) sử dụng hướng mở/đóng nến làm đại diện. Kết quả được hiển thị dưới dạng biểu đồ ngang nhiều lớp neo vào ranh giới thời gian của phiên.
Các Yếu Tố Hình Ảnh
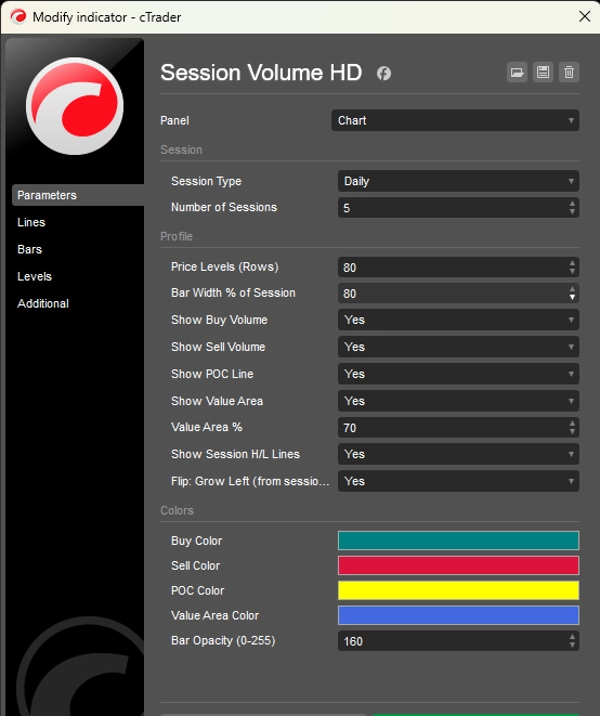
Nến Mua (Màu Xanh Lơ) — Hiển thị khối lượng giao dịch theo chuyển động giá tăng ở mỗi mức. Tăng về bên trái (hoặc bên phải nếu đảo chiều) từ điểm neo phiên.
Nến Bán (Màu Đỏ) — Hiển thị khối lượng giao dịch theo chuyển động giá giảm ở mỗi mức, xếp chồng bên cạnh nến mua.
Đường POC (Màu Vàng) — Điểm Kiểm Soát. Một đường ngang đánh dấu mức giá có tổng khối lượng cao nhất trong phiên. Hoạt động như một nam châm hút giá.
Khu Vực Giá Trị (Lớp phủ màu Xanh) — Phạm vi giá chứa một tỷ lệ phần trăm có thể cấu hình (mặc định 70%) của tổng khối lượng phiên. Đại diện cho vùng "giá trị hợp lý" nơi diễn ra phần lớn giao dịch.
Đường H/L Phiên (Chấm trắng) — Đánh dấu mức giá cao nhất và thấp nhất đạt được trong phiên.
Hiệu Suất
Chỉ báo chỉ vẽ lại một lần cho mỗi nến mới, không phải trên mỗi tick. Điều này loại bỏ hiện tượng nhấp nháy và đảm bảo hiển thị ổn định ngay cả với nhiều phiên và số lượng mức giá cao.
Hạn Chế
Vì cTrader không cung cấp khối lượng mua/bán thực sự ở cấp độ nến nếu không có dữ liệu tick, khối lượng mua/bán được ước lượng dựa trên hướng nến: nến tăng được tính 65% mua / 35% bán, nến giảm ngược lại, và nến doji chia đều 50/50. Để có khối lượng delta thực sự cần có đăng ký dữ liệu tick.


