
Cross EMA Pro
Chỉ báo
2 lượt mua
Phiên bản 1.0, Sep 2024
Windows, Mac
4.5
Đánh giá: 2
Mô tả
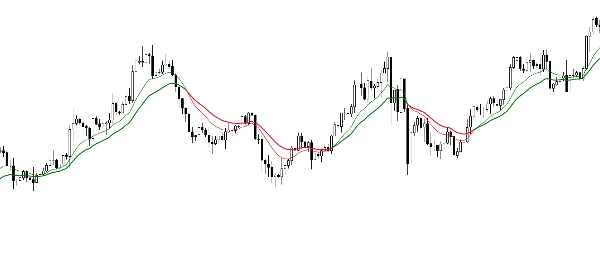
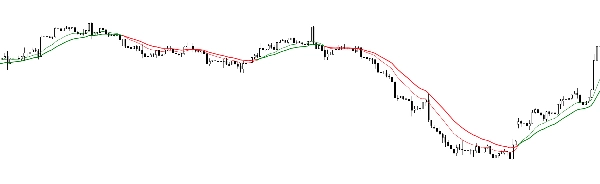
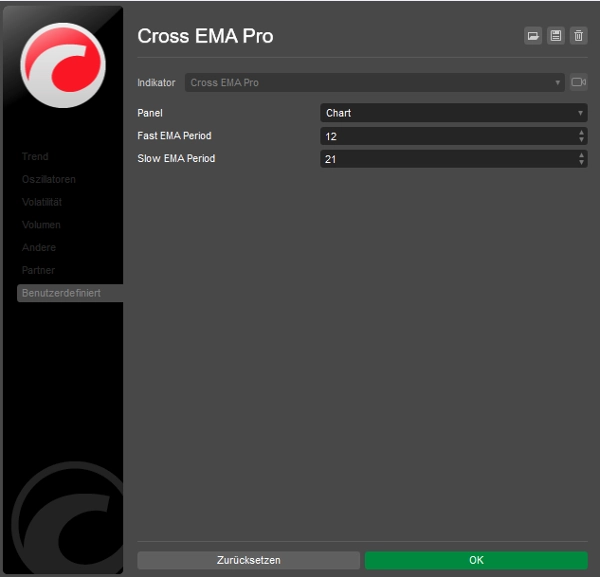
Cross EMA Pro giúp bạn xác định chính xác các điểm đảo chiều xu hướng bằng cách trực quan hóa sự giao cắt của EMA 12 kỳ và 21 kỳ. Mã màu giúp dễ dàng nhận biết nhanh hướng đi của xu hướng.
- Tín hiệu giao cắt: Dựa trên EMA 12 kỳ và 21 kỳ
- Mã màu: Màu xanh cho xu hướng tăng, màu đỏ cho xu hướng giảm
- Sử dụng linh hoạt: Phù hợp cho scalping, giao dịch trong ngày và các chiến lược dài hạn
Tóm tắt
Tóm tắt AI
Cross EMA Pro is a trend reversal indicator that visualizes the crossover of 12-period and 21-period exponential moving averages (EMAs). It uses color coding—green for uptrends and red for downtrends—to help users quickly identify trend directions. The indicator provides clear crossover signals based on these two EMAs, making it suitable for various trading styles including scalping, day trading, and long-term strategies. It supports multiple markets such as Forex, stocks, indices, commodities, and cryptocurrencies including BTCUSD and XAUUSD. The indicator outputs visual signals on price charts to assist traders in recognizing potential trend reversals.
Hồ sơ chỉ báo
Danh mục chỉ báo
Xu hướng
Loại đầu ra
Hình ảnh trực quan
Yêu cầu dữ liệu
Chỉ dữ liệu nến
Đánh giá của khách hàng
4.5
Đánh giá: 2
5 | 50 % | |
4 | 50 % | |
3 | 0 % | |
2 | 0 % | |
1 | 0 % |
Đánh giá của khách hàng
September 22, 2024
September 22, 2024
No reason to yolo this live without a few normal sessions, and M15 is enough for the first pass.
Thảo luận
Câu hỏi thường gặp
BTCUSD
Forex
Indices
Commodities
Crypto
Stocks
XAUUSD
Các sản phẩm có sẵn trên cTrader Store, bao gồm bot giao dịch, chỉ báo và plugin, được cung cấp bởi các nhà phát triển bên thứ ba và chỉ nhằm mục đích cung cấp thông tin và tiếp cận kỹ thuật. cTrader Store không phải là nhà môi giới và không cung cấp lời khuyên đầu tư, khuyến nghị cá nhân hay bất kỳ đảm bảo nào về hiệu suất trong tương lai.
Sản phẩm khác của tác giả này

![Logo "Wyckoff Toolkit [Iridio Capital]"](https://cdn.ctrader.com/image/webp/8acfe6a1-6a8e-4578-9367-9df3af2b1801_27763)


![Logo "[Stellar Strategies] Smart ADX"](https://cdn.ctrader.com/image/webp/af13b084-b6f6-41db-b7bc-c7e688b57b05_36929)
Giá
Kể từ 11/09/2024
7
Lượt bán