

VegaXLR - cTrader Pitchfork & Channel Enhancer
Chỉ báo
4 lượt mua
Phiên bản 1.1, Jul 2026
Windows, Mac
4.5
Đánh giá: 2

255
Lượt bán
1.49K
Cài đặt miễn phí
Mô tả
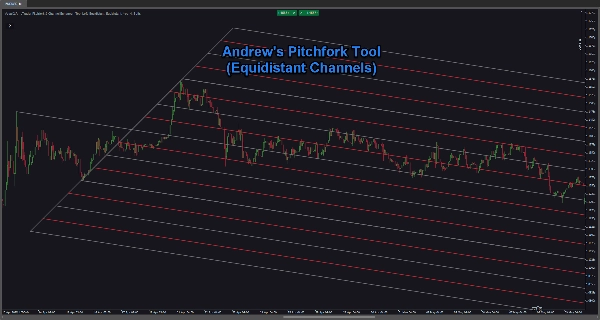
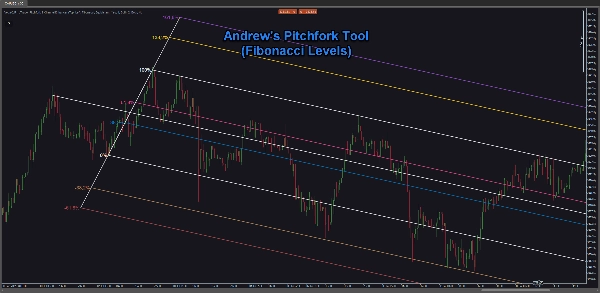
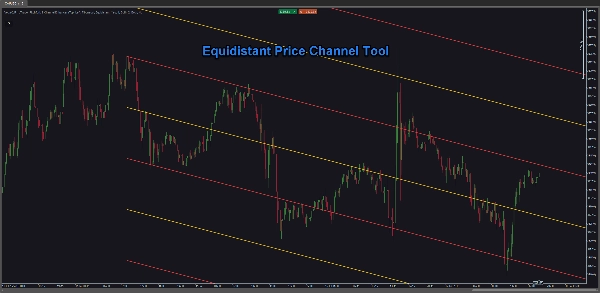
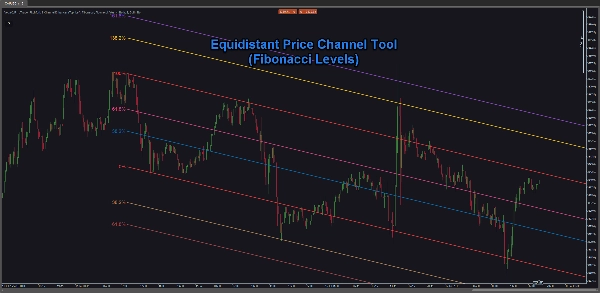
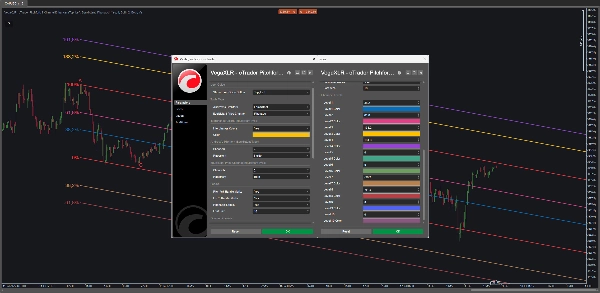
cTrader Pitchfork & Channel Enhancer là một chỉ báo được thiết kế để cải thiện Pitchfork của Andrew và Kênh Giá Cách đều trong cTrader. Nó cho phép bạn thêm các mức Fibonacci và Cách đều tùy chỉnh, tạo nhiều kênh và điều chỉnh vị trí của chúng một cách chính xác.
Tính năng:
- Thêm các mức Cách đều hoặc Fibonacci tùy chỉnh vào Pitchfork và Kênh Giá của bạn.
- Sử dụng các lệnh đơn giản để nhanh chóng tùy chỉnh các đối tượng biểu đồ của bạn.
- Thêm nhãn và điều chỉnh màu sắc để tổ chức biểu đồ tốt hơn.
- Các đường thẳng được căn chỉnh hoàn hảo mỗi lần.
- Bao gồm hướng dẫn sử dụng.
Công cụ này hoàn hảo cho các nhà giao dịch muốn tinh chỉnh Pitchfork và Kênh Giá của họ với các tùy chọn tùy chỉnh nâng cao. Nó đơn giản hóa quá trình thêm các mức chính xác và nhiều kênh, giúp bạn tập trung vào việc phân tích xu hướng thị trường và đưa ra các quyết định sáng suốt.
Tóm tắt
AI summary
VegaXLR - cTrader Pitchfork & Channel Enhancer is an indicator designed to enhance Andrew’s Pitchfork and Equidistant Price Channels within the cTrader platform. It enables traders to add customizable Fibonacci and Equidistant levels to their Pitchfork and Price Channels, allowing for precise technical analysis. Users can create multiple channels and adjust their placement with accuracy. The tool supports simple commands for quick customization of chart objects, including adding labels and adjusting colors to improve chart organization. It ensures perfectly aligned lines for consistent visual representation. This indicator is suitable for markets including Forex, Indices, Crypto, and Stocks, supporting analysis across various asset classes. A user guide is included to assist with setup and usage. A demonstration video is available to illustrate its features and functionality.
Hồ sơ chỉ báo
Đánh giá của khách hàng
4.5
Đánh giá: 2
5 | 50 % | |
4 | 50 % | |
3 | 0 % | |
2 | 0 % | |
1 | 0 % |
Thảo luận
Câu hỏi thường gặp
Forex
Breakout
Indices
Crypto
Stocks
Các sản phẩm có sẵn trên cTrader Store, bao gồm bot giao dịch, chỉ báo và plugin, được cung cấp bởi các nhà phát triển bên thứ ba và chỉ nhằm mục đích cung cấp thông tin và tiếp cận kỹ thuật. cTrader Store không phải là nhà môi giới và không cung cấp lời khuyên đầu tư, khuyến nghị cá nhân hay bất kỳ đảm bảo nào về hiệu suất trong tương lai.

























Giá
255
Lượt bán
1.49K
Cài đặt miễn phí