
Market_Session_Forex
Indicatore
4 acquisti
Versione 1.0, Jul 2025
Windows, Mac
4.5
Recensioni: 2
Descrizione
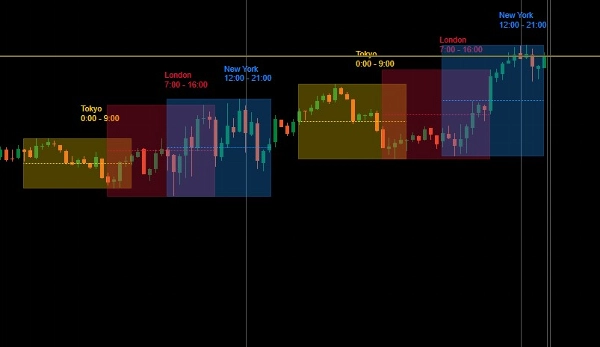
Il mercato Forex opera 24 ore al giorno attraverso sessioni di trading globali sovrapposte. Ogni sessione riflette l'attività dei principali centri finanziari ed è caratterizzata da diversi livelli di liquidità, volatilità e volume di scambi.
📊 Il grafico mostra tre sessioni principali in blocchi di tempo coordinati:
🟡 Sessione di Tokyo (Sessione Asiatica)
🔴 Sessione di Londra (Sessione Europea)
🔵 Sessione di New York (Sessione USA)
🧩 Periodi di Sovrapposizione:
- Sovrapposizione Londra–New York
Periodo più attivo della giornata di trading con volume di picco e principali movimenti di prezzo.
I Miei Altri Prodotti
- Institutional FVG Zones MTF with Confluence
- All-in-One Session Levels Suite
- MARKET_STRUCTURE BOS_CHoCH
- Multi_TF Candlestick Chart Overlay
- ICT Killzones & Macros
- ICT_SMC_ToolKit
- VWAP_MTF
- Traders Dynamic Index (TDI)
- Market_Session_Forex
Riepilogo
Riepilogo AI
Market_Session_Forex is an indicator designed for forex trading that visually delineates the three primary global trading sessions on a chart: the Tokyo (Asian) session, the London (European) session, and the New York (U.S.) session. Each session is displayed in coordinated time blocks, highlighting periods of varying liquidity, volatility, and trading volume. The indicator also marks the London–New York overlap, recognized as the most active trading period with peak volume and significant price movements. This tool aids traders in identifying key market activity windows aligned with major financial centers, facilitating more informed trading decisions based on session timing.
Profilo indicatore
Recensioni dei clienti
4.5
Recensioni: 2
5 | 50 % | |
4 | 50 % | |
3 | 0 % | |
2 | 0 % | |
1 | 0 % |
Recensioni dei clienti
August 7, 2025
July 31, 2025
ngl, weak ideas are easier to skip and that is enough to keep testing it. It is one check, not the full trade.
Discussioni
Domande frequenti
I prodotti disponibili tramite cTrader Store, inclusi bot di trading, indicatori e plugin, sono forniti da sviluppatori terzi e resi disponibili esclusivamente a scopo informativo e di accesso tecnico. cTrader Store non è un broker e non fornisce consulenze in materia di investimento, raccomandazioni individualizzate o garanzie di risultati futuri.


![Logo di "[CB] Pivot Points Pro"](https://cdn.ctrader.com/image/webp/43463c82-67b0-4f10-a4ba-901bba091d81_32594)


Prezzo
Da 22/06/2025
79
Vendite
78
Installazioni gratuite