
Descrizione
Algoritmo Intelligente di Inseguimento
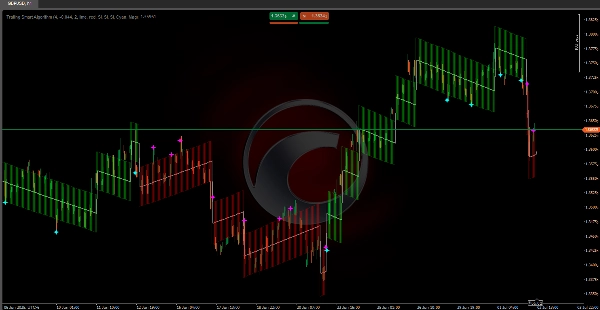
https://chartshots.spotware.com/c/69f0f1d89000b
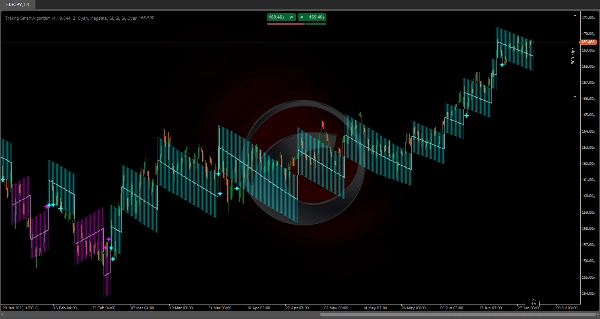
Incorpora algoritmi matematici 🧠 progettati specificamente per tracciare costantemente il prezzo in qualsiasi condizione di mercato 🌐.
La sua struttura di calcolo garantisce che la linea di tendenza rimanga sempre sincronizzata con i movimenti del prezzo, evitando il tipico ritardo degli indicatori tradizionali ⏳.
A differenza degli algoritmi convenzionali, questo sistema utilizza misurazioni precise della volatilità 📊 e applica aggiustamenti automatici ⚙️ che garantiscono un tracciamento ottimale. I suoi calcoli interni sono progettati per fornire una rappresentazione accurata della direzione del mercato, mantenendo la precisione sia durante movimenti rapidi ⚡ che nello sviluppo graduale della tendenza 🕊️.
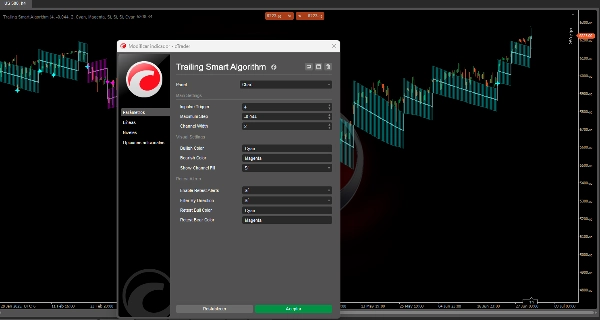
https://chartshots.spotware.com/c/69f0f218591b0
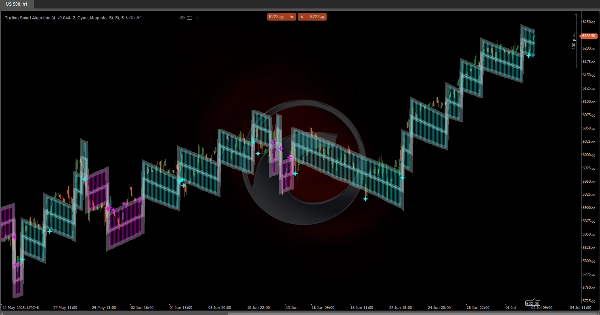
💡 Come Funziona?
L'indicatore opera utilizzando un sistema a passi adattivi che si muove nella direzione della tendenza dominante.
Si basa su tre componenti principali:
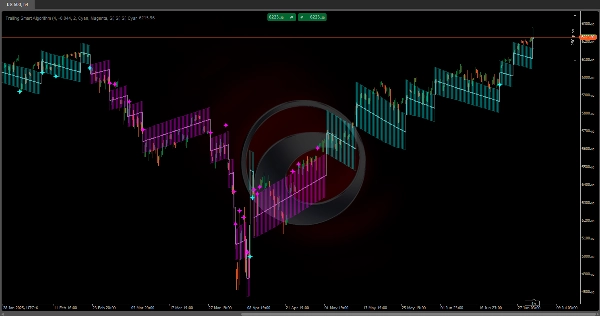
https://chartshots.spotware.com/c/69f0f2b19e4d3
1️⃣ Rilevamento del Cambiamento di Tendenza
Il sistema monitora continuamente il prezzo per rilevare movimenti significativi che superano una soglia specifica (Trigger di Impulso 🎯).
Quando il prezzo si allontana abbastanza dalla linea di tendenza corrente, l'indicatore riconosce un potenziale cambiamento di direzione e riposiziona la sua linea principale.
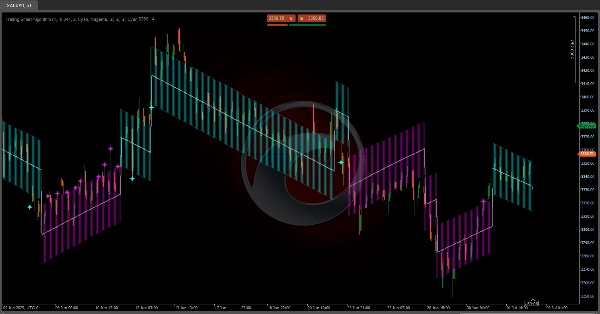
2️⃣ Inseguimento Dinamico
Una volta impostata la direzione, la linea di tendenza si muove passo dopo passo 🪜 nella stessa direzione del mercato.
Ogni passo è calcolato in base alla volatilità corrente (ATR 📈):
• In mercati più volatili, i passi sono più grandi 🌊
• In mercati più tranquilli, i passi sono più piccoli 🌿
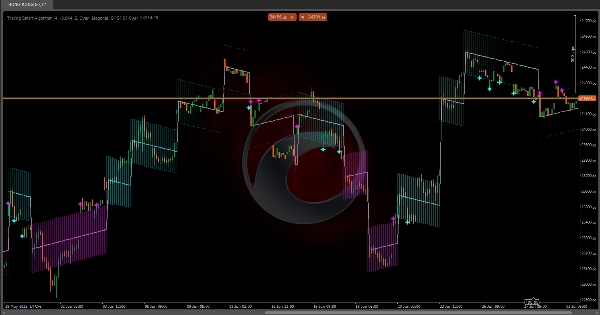
3️⃣ Canale di Volatilità
Un canale si forma attorno alla linea principale (bande superiore e inferiore) rappresentando la zona di volatilità normale 📉📈.
Questo canale aiuta a identificare se il prezzo si comporta entro parametri normali o sta effettuando movimenti estremi 🚨.
📏 Canale di Volatilità
• Banda Superiore: Limite superiore del canale di volatilità
• Banda Inferiore: Limite inferiore del canale di volatilità
✨ Segnali di Ritest
• Stelle Ciano 🌟: Il prezzo tocca o attraversa la banda inferiore durante un trend rialzista
• Stelle Magenta ⭐: Il prezzo tocca o attraversa la banda superiore durante un trend ribassista
⚙️ Impostazioni dei Parametri
🔹 Parametri Principali
Trigger di Impulso (valore predefinito: 4)
Cosa fa?
Determina la sensibilità per rilevare i cambiamenti di tendenza. È il moltiplicatore ATR che definisce quanto il prezzo deve muoversi per attivare un cambiamento di direzione.
Impatto se modificato:
• Valori più alti (5–8):
- Più resistente ai cambiamenti di tendenza 🛡️
- Meno segnali falsi
- Risposta più lenta ai cambiamenti reali
• Valori più bassi (2–3):
- Maggiore sensibilità 🎯
- Reazione più veloce
- Più probabile generare segnali falsi in mercati laterali
Passo Massimo (valore predefinito: -0.044)
Cosa fa?
Limita la dimensione massima di ogni passo che la linea di tendenza può fare. È un valore negativo che agisce come limite.
Impatto se modificato:
• Meno negativo (-0.020 a -0.030):
- Passi più grandi 🚀
- Tracciamento della tendenza più aggressivo
• Più negativo (-0.050 a -0.080):
- Passi più piccoli e graduali 🌱
- Seguimento più conservativo
Larghezza del Canale (valore predefinito: 2)
Cosa fa?
Definisce la larghezza del canale di volatilità attorno alla linea principale.
Impatto se modificato:
• Valori più alti (3–4):
- Canale più ampio 🟢
- Meno segnali di ritest
- Maggiore tolleranza alla volatilità
• Valori più bassi (1–1.5):
- Canale più stretto 🔴
- Più segnali di ritest
- Maggiore sensibilità al rumore
🎨 Parametri Visivi
Colore Rialzista / Colore Ribassista
Definisce i colori per trend rialzisti e ribassisti rispettivamente.
Mostra Riempimento Canale
Abilita o disabilita il riempimento visivo del canale di volatilità 🌈.
🔔 Impostazioni di Ritest
Abilita Avvisi di Ritest
Attiva o disattiva i segnali di ritest quando il prezzo tocca le bande del canale.
Filtra per Direzione
Quando abilitato, mostra solo segnali di ritest corrispondenti alla tendenza attuale:
• In un trend rialzista: Solo segnali sulla banda inferiore
• In un trend ribassista: Solo segnali sulla banda superiore
🌟 Riepilogo Segnali di Ritest
• Stella Ciano sulla Banda Inferiore: Potenziale rimbalzo rialzista da supporto dinamico ✅
• Stella Magenta sulla Banda Superiore: Potenziale rimbalzo ribassista da resistenza dinamica ❌
Riepilogo
Recensioni dei clienti
5 | 100 % | |
4 | 0 % | |
3 | 0 % | |
2 | 0 % | |
1 | 0 % |


