
Descrizione
Indicator del Pinescriptlabs Store: cBot del Pinescriptlabs Store : (cBot) Gold & BTC BreakoutSession Pivots(nuovo)
Mappa di Liquidazione della Leva
Previsione Basata su Linreg & ATR
SmartTrend Supporto &
Resistenza
Linee
Sistema di Breakout del Canale
Analisi
Dinamica
della Struttura
di Mercato
dei
Punti di Inversione
Regressione
Lineare
Fibonacci
Multi-timeframe
Proiezione del Flusso di Mercato
Gradiente Dinamico di Tendenza
Tracciatore
Multi-Livello
di Bias delle Candele
Tracker
Tracciatore di Estremi Zig-Zag
Supporto
e Resistenza
Automatici
Linee di Tendenza
Linee
Tutti
i Livelli di
Supporto e Resistenza
Livelli
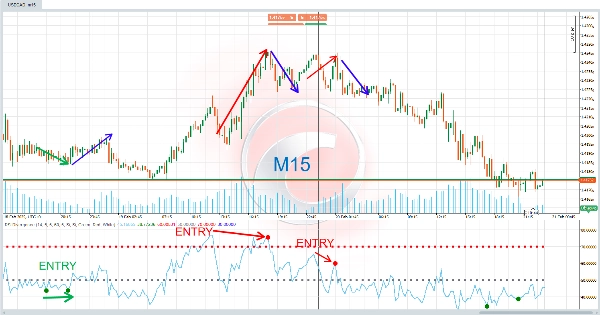
Il RSI Divergence è uno strumento avanzato di analisi tecnica progettato per rilevare divergenze tra il prezzo e l'Indice di Forza Relativa (RSI) . Queste divergenze sono segnali potenti che possono anticipare cambiamenti nella direzione del mercato, rendendolo una risorsa preziosa per i trader tecnici. 🔍💡
⚙️ Come Funziona?
Questo indicatore opera sul principio che il prezzo e l'RSI non si muovono sempre in sincronia. Quando si verifica una divergenza, significa che il prezzo sta inviando un segnale contrario alla tendenza sottostante dell'RSI. Questo può essere un avvertimento precoce che la tendenza attuale potrebbe perdere forza.
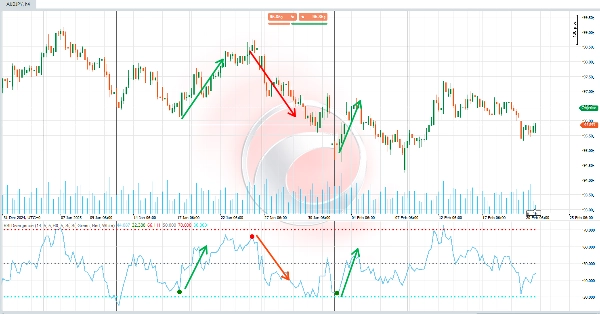
- Divergenza Rialzista (Trend al Rialzo) 📈 :
Si verifica quando il prezzo forma minimi più bassi , ma l'RSI forma minimi più alti . Questo suggerisce che, anche se il prezzo sta scendendo, lo slancio al rialzo potrebbe guadagnare terreno, portando potenzialmente a un'inversione verso l'alto. ✅ - Divergenza Ribassista (Trend al Ribasso) 📉 :
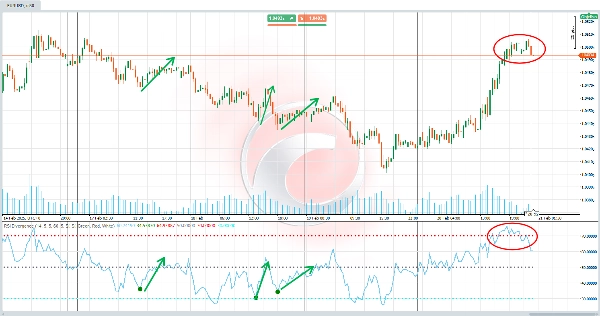
Si verifica quando il prezzo forma massimi più alti , ma l'RSI forma massimi più bassi . Questo suggerisce che, anche se il prezzo sta salendo, lo slancio al ribasso potrebbe guadagnare terreno, portando potenzialmente a un'inversione verso il basso. ❌
L'indicatore rileva automaticamente queste divergenze e le evidenzia sul grafico con colori, linee ed etichette per una facile interpretazione. 🎯
💡 A Cosa Serve?
Questo indicatore è particolarmente utile per:
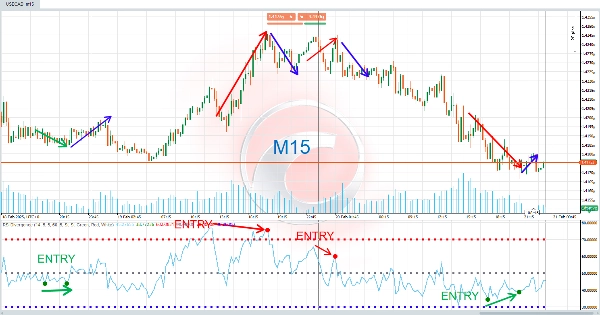
- Identificare punti di entrata e uscita : Le divergenze possono agire come segnali di acquisto (rialzisti) o vendita (ribassisti). 🛒💸
- Anticipare cambiamenti di tendenza : Le divergenze sono segnali precoci che la tendenza attuale potrebbe perdere forza. ⚡
- Confermare l'analisi tecnica : Può essere usato insieme ad altri indicatori o pattern di candele per convalidare le decisioni di trading. 🧠📊
È ideale sia per i trader intraday che per gli investitori a lungo termine, poiché le divergenze si applicano a qualsiasi timeframe. ⏳📈
🛠️ Come Usarlo?
- Configurazione Iniziale:
-
- Personalizza i parametri in base alle tue esigenze, come il periodo RSI, gli intervalli di ricerca dei pivot e i colori dei segnali. 🎨⚙️
- Abilita o disabilita la visualizzazione delle divergenze rialziste o ribassiste in base alle tue preferenze. ✅❌
- Interpretazione dei Segnali:
-
- Divergenza Rialzista : Quando appare un segnale "D" verde sul grafico, indica una possibile opportunità di acquisto. 🟩🛒
- Divergenza Ribassista : Quando appare un segnale "D" rosso sul grafico, indica una possibile opportunità di vendita. 🟥🚫
- Inoltre, vengono tracciate linee che collegano i punti di divergenza per facilitare l'analisi visiva. 📐🔗
- Decisione:
-
- Usa questi segnali per adattare le tue strategie, come aprire posizioni, chiudere operazioni esistenti o regolare i livelli di stop-loss. 🤝💼
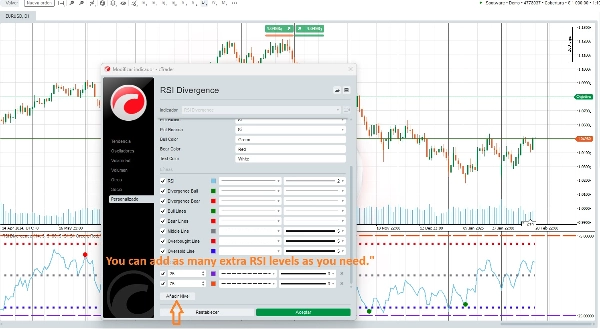
🆕 Personalizzazione Avanzata!
🌟 Puoi aggiungere tutti i livelli RSI che l'utente desidera 🌟
Questo indicatore ti permette di personalizzare completamente la tua esperienza di trading. Puoi aggiungere più livelli RSI per adattarlo a diverse strategie e stili di trading. Ad esempio, puoi configurare livelli aggiuntivi di ipercomprato e ipervenduto o persino regolare il periodo RSI per adattarlo a diversi timeframe. 🔄📈📉
Riepilogo
Designed for use on any timeframe, the indicator helps traders identify entry and exit points, anticipate trend changes, and confirm other technical analysis signals. Users can customize parameters such as RSI period, pivot search ranges, signal colors, and enable or disable specific divergence types. Additionally, multiple RSI levels can be added to tailor the indicator to various trading strategies and styles.
This tool is suitable for intraday traders and long-term investors across markets including cryptocurrencies (e.g., BTCUSD), commodities (e.g., gold, XAUUSD), and indices. It supports enhanced decision-making by providing early warnings of trend strength shifts based on RSI divergence analysis.
Recensioni dei clienti
5 | 0 % | |
4 | 100 % | |
3 | 0 % | |
2 | 0 % | |
1 | 0 % |


