
Descrizione
MFI-MTF: Indice di Flusso di Denaro Multi-Timeframe
Panoramica
MFI-MTF è un indicatore di momentum multi-timeframe che porta una prospettiva di timeframe superiore al tuo grafico attuale. Calcolando l'Indice di Flusso di Denaro (MFI) su un timeframe più ampio e visualizzandolo sul tuo grafico di lavoro, questo indicatore ti aiuta a identificare condizioni di ipercomprato e ipervenduto attraverso molteplici prospettive di mercato senza dover cambiare manualmente tra i timeframe.
Cosa Fa
Analisi dell'Indice di Flusso di Denaro: L'indicatore misura la pressione di acquisto e vendita analizzando sia il movimento del prezzo che il volume degli scambi. Oscilla tra 0 e 100, identificando quando un asset ha subito una pressione eccessiva di acquisto (ipercomprato) o di vendita (ipervenduto).
Contesto di Timeframe Superiore: Invece di calcolare l'MFI sul timeframe del tuo grafico attuale, MFI-MTF preleva dati da un timeframe più ampio che specifichi (giornaliero, settimanale, 4 ore, ecc.). Questo ti offre approfondimenti sul momentum a livello istituzionale senza il rumore dei timeframe inferiori. Quando l'MFI giornaliero mostra condizioni di ipercomprato, ad esempio, sai che il trend più ampio sta raggiungendo l'esaurimento—un contesto prezioso per decisioni di entrata e uscita.
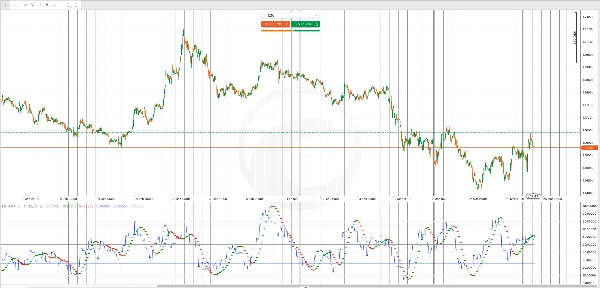
Filtro Hull Moving Average: Una Hull Moving Average (HMA) applicata all'MFI smussa i falsi segnali e mette in evidenza i cambiamenti di momentum direzionale. I punti verdi indicano trend di momentum in salita, mentre i punti rossi indicano trend in discesa, fornendoti una rapida conferma visiva dei cambiamenti nella direzione del momentum.
Output Chiave
Linea MFI (Blu): Il valore principale dell'Indice di Flusso di Denaro dal timeframe superiore selezionato, visualizzato su ogni barra del tuo grafico attuale.
Segnali HMA (Punti Verdi/Rossi): I punti verdi appaiono quando il momentum si rafforza verso l'alto; i punti rossi appaiono quando il momentum si indebolisce o si inverte verso il basso. Questi servono come segnali di allarme precoce per potenziali inversioni.
Livelli di Riferimento:
- Livello di Ipercomprato (default 70): Quando l'MFI supera questo valore, la pressione di acquisto è eccessiva e le inversioni diventano probabili
- Livello di Ipervenduto (default 30): Quando l'MFI scende sotto questo valore, la pressione di vendita è esaurita e i rimbalzi diventano probabili
- Linea Centrale (50): Il punto di equilibrio neutro tra momentum rialzista e ribassista
Personalizzazione
Selezione del Timeframe: Scegli qualsiasi timeframe superiore al tuo grafico attuale (giornaliero su un grafico a 1 ora, per esempio). Timeframe più ampi forniscono un contesto di trend più ampio ma segnali meno frequenti; incrementi più piccoli offrono più opportunità di trading ma con una prospettiva meno strategica.
Periodo MFI: Regola il periodo di lookback per l'Indice di Flusso di Denaro (default 14). Periodi più brevi rendono l'indicatore più reattivo ai cambiamenti recenti del volume; periodi più lunghi smussano la volatilità e riducono i falsi segnali.
Periodo HMA: Controlla la smussatura del filtro di momentum. Periodi più brevi rendono i cambiamenti di trend più evidenti ma più rumorosi; periodi più lunghi confermano i trend in modo più affidabile ma con una generazione di segnali più lenta.
Soglie di Ipercomprato/Ipervenduto: Personalizza questi livelli per adattarli al tuo stile di trading. I trader conservativi potrebbero usare 75/25; i trader aggressivi potrebbero usare 80/20 per attendere condizioni più estreme.
Uso Pratico
Usa MFI MTF per aggiungere convalida alle tue entrate e uscite. Un segnale di vendita sul tuo timeframe di lavoro diventa più affidabile se l'MFI giornaliero è già in ipercomprato, indicando che i venditori istituzionali sono probabilmente attivi. Allo stesso modo, i segnali di acquisto guadagnano forza quando l'MFI del timeframe superiore è in ipervenduto, mostrando che la pressione di vendita si è esaurita a livello macro.
I cambiamenti di colore della HMA ti forniscono avvisi in tempo reale sui cambiamenti di momentum, aiutandoti a uscire precocemente da operazioni in perdita o a ridurre la dimensione della posizione prima che le inversioni diventino gravi.
Riepilogo
The indicator includes a Hull Moving Average (HMA) filter applied to the MFI to smooth out noise and highlight momentum shifts. Green dots indicate strengthening upward momentum, while red dots signal weakening or downward momentum. Reference levels include default overbought (70), oversold (30), and a neutral midpoint (50), all customizable to fit different trading styles.
Key outputs are the MFI line from the chosen higher timeframe and HMA signals for momentum direction changes. Adjustable parameters include the MFI lookback period, HMA smoothing period, and overbought/oversold thresholds. MFI-MTF aids in confirming entry and exit points by providing institutional-level momentum insights and real-time alerts to momentum shifts on your working chart.
Recensioni dei clienti
5 | 100 % | |
4 | 0 % | |
3 | 0 % | |
2 | 0 % | |
1 | 0 % |


