
Descrizione
Indicatore Multi-Timeframe Quantitative Qualitative Estimation (QQE)
L'indicatore Quantitative Qualitative Estimation (QQE) è uno strumento di analisi tecnica che migliora il Relative Strength Index (RSI) incorporando medie mobili smussate. Aiuta i trader a valutare la forza del trend, potenziali inversioni e condizioni di ipercomprato/ipervenduto con maggiore precisione.
QQE presenta due componenti chiave: i livelli di trailing stop veloci e lenti, che fungono da supporto e resistenza dinamici. Questo lo rende uno strumento versatile sia per strategie di trend-following che di mean-reversion. Un incrocio tra la linea QQE e la sua linea di segnale spesso indica potenziali opportunità di acquisto o vendita.
QQE Multi-Timeframe: Una Versione Avanzata
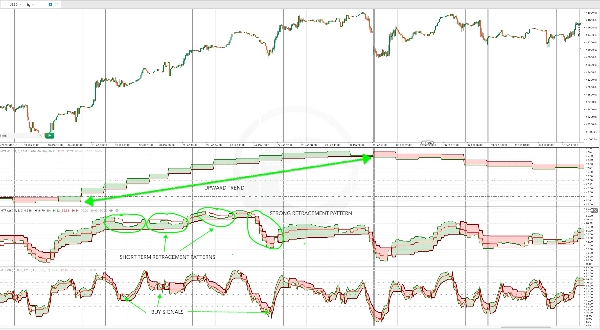
Questa versione migliorata dell'indicatore QQE è progettata come uno strumento multi-timeframe, integrando sia linee di tendenza veloci che lente per una precisione migliorata. Analizzando l'azione del prezzo su più timeframe, fornisce una vista completa delle tendenze di mercato.
Il suo algoritmo di smussamento avanzato ne aumenta l'affidabilità, rendendolo un indicatore autonomo efficace per:
✅ Identificare la direzione del trend
✅ Generare segnali precisi di entrata e uscita
✅ Rilevare condizioni di ipercomprato e ipervenduto
La flessibilità del QQE Multi-Timeframe lo rende adatto sia per strategie di trend-following che di inversione.
Come Usare il QQE Multi-Timeframe
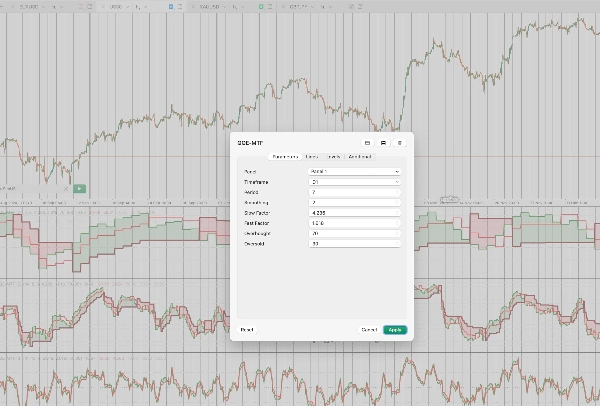
Per configurare il QQE Multi-Timeframe, i trader devono selezionare:
🔹 Un timeframe (es. Daily, H4, H1)
🔹 Periodi (numero di candele usate nel calcolo)
🔹 Un periodo di smussamento (per lo smussamento dell'RSI)
🔹 Fattori lenti e veloci (per regolare la sensibilità)
🔹 Livelli personalizzabili di ipercomprato e ipervenduto
📌 Nota: Poiché si tratta di un indicatore multi-timeframe, dopo averlo aggiunto al grafico, è essenziale fare zoom out nell'interfaccia cTrader per permettere il caricamento sufficiente dei dati e l'inizializzazione corretta dell'indicatore.
Strategie di Trading con il QQE Multi-Timeframe
1️⃣ QQE per la Conferma del Trend su Timeframe Elevati
Un modo efficace per usare il QQE Multi-Timeframe è per la conferma del trend su un timeframe superiore mentre si identificano entrate di ritracciamento su un timeframe inferiore.
Per esempio:
- Il QQE sul timeframe giornaliero viene usato per confermare un trend forte.
- Le entrate di ritracciamento vengono poi identificate quando lo Stochastic Oscillator attraversa i livelli di ipercomprato o ipervenduto.
Questo metodo aiuta i trader ad allineare le loro entrate con il trend generale.
2️⃣ Analisi Multi-Timeframe per Approfondimenti di Mercato
L'uso del QQE su più timeframe permette ai trader di ottenere una comprensione più dettagliata del comportamento di un asset.
Per esempio, applicando il QQE su:
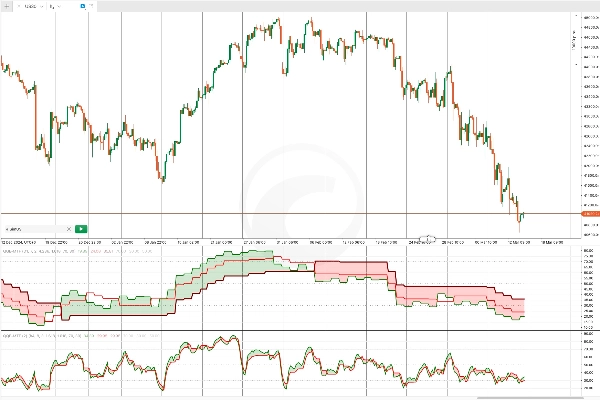
📊 Timeframe giornaliero (D1): Determina la direzione generale del trend.
📊 Timeframe a 4 ore (H4): Conferma la direzione del trend e identifica ritracciamenti a breve termine.
📊 Timeframe a 1 ora (H1): Genera segnali precisi di entrata basati su condizioni di ipercomprato/ipervenduto o movimenti controtrend.
Questo approccio strutturato migliora il timing delle operazioni e il processo decisionale allineando i segnali attraverso diversi timeframe.
Riepilogo
This advanced multi-timeframe tool integrates fast and slow trend lines to analyze price action across different timeframes, providing a comprehensive view of market trends. Its smoothing algorithm improves reliability, making it effective for identifying trend direction, generating precise entry and exit signals, and detecting overbought/oversold levels.
Users configure the indicator by selecting a timeframe (e.g., Daily, H4, H1), periods for calculation, smoothing period for RSI, sensitivity factors, and customizable overbought/oversold thresholds. It is recommended to zoom out in the cTrader interface after adding the indicator to allow sufficient data loading.
Typical strategies include using the QQE on higher timeframes for trend confirmation and on lower timeframes for entry timing, as well as multi-timeframe analysis to enhance trade timing and decision-making by aligning signals across timeframes.
Recensioni dei clienti
5 | 50 % | |
4 | 50 % | |
3 | 0 % | |
2 | 0 % | |
1 | 0 % |


