
Descrizione
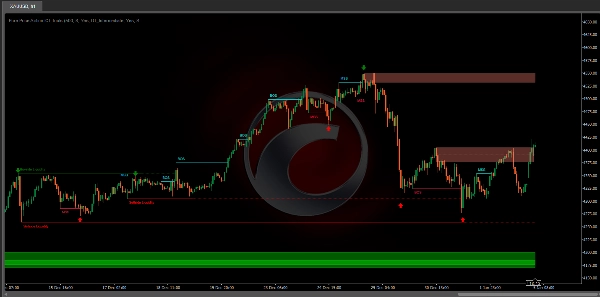
L'indicatore Pure Price Action ICT Tools è progettato per un'analisi pura dell'azione del prezzo, identificando automaticamente le strutture di mercato in tempo reale, i livelli di liquidità, gli order & breaker blocks e le lacune di liquidità.
La sua caratteristica unica risiede nella sua esclusiva dipendenza dai pattern di prezzo, senza essere vincolato da input definiti dall'utente, garantendo un'analisi robusta e obiettiva delle dinamiche di mercato.
Caratteristiche principali
- Strutture di mercato
Un Market Structure Shift, noto anche come Change of Character (CHoCH), è un evento cruciale nell'analisi dell'azione del prezzo che indica un potenziale cambiamento nel sentimento o nella direzione del mercato. Un MSS si verifica quando il prezzo si inverte da una tendenza consolidata, segnalando che la tendenza prevalente potrebbe perdere slancio e che potrebbe essere in corso un'inversione. Questo cambiamento è spesso identificato da pattern tecnici chiave, come un minimo più alto in una tendenza al ribasso o un massimo più basso in una tendenza al rialzo, che indicano un indebolimento della forza della tendenza attuale.
Un Break of Structure tipicamente indica la continuazione della tendenza di mercato attuale. Questo evento si verifica quando il prezzo si muove decisamente oltre un precedente massimo o minimo di oscillazione, confermando la forza della tendenza prevalente. In una tendenza al rialzo, un BOS è segnato dal prezzo che supera un precedente massimo, mentre in una tendenza al ribasso, è identificato dal prezzo che scende sotto un precedente minimo.
Mentre un Market Structure Shift (MSS) può indicare una potenziale inversione di tendenza e un Break of Structure (BOS) spesso conferma la continuazione della tendenza, non garantiscono una completa inversione o continuazione. I livelli MSS e BOS possono anche funzionare come zone di liquidità o aree di consolidamento del prezzo piuttosto che segnalare definitivamente un cambiamento nella direzione del mercato. I trader dovrebbero approcciare questi segnali con cautela e validarli con fattori aggiuntivi prima di prendere decisioni di trading. Per ulteriori dettagli sugli altri componenti dello strumento, si prega di fare riferimento alle sezioni seguenti.
- Order & Breaker Blocks
Order e Breaker Blocks sono concetti chiave nell'analisi dell'azione del prezzo che aiutano i trader a identificare livelli significativi nella struttura di mercato.
Gli Order Blocks sono zone di prezzo specifiche dove si è verificata un'attività significativa di acquisto o vendita. Queste zone rappresentano spesso le azioni di grandi trader istituzionali o market maker, che eseguono ordini sostanziali che influenzano il mercato.
I Breaker Blocks sono zone di prezzo specifiche dove si verifica una forte inversione, causando una rottura nella struttura di mercato prevalente. Questi blocchi indicano aree dove il prezzo ha incontrato una resistenza o un supporto significativo, portando a un'inversione.
In sintesi, la liquidità dal lato acquisto e dal lato vendita fornisce preziose informazioni sulle dinamiche di domanda e offerta del mercato, aiutando i trader a prendere decisioni informate basate sulla disponibilità di ordini a diversi livelli di prezzo.
- Liquidità dal lato acquisto e dal lato vendita
Sia le zone di liquidità dal lato acquisto che dal lato vendita sono fondamentali per identificare potenziali punti di svolta nel mercato. Queste zone sono dove si concentra un interesse significativo di acquisto o vendita, influenzando i movimenti futuri del prezzo.
In sintesi, la liquidità dal lato acquisto e dal lato vendita fornisce preziose informazioni sulle dinamiche di domanda e offerta del mercato, aiutando i trader a prendere decisioni informate basate sulla disponibilità di ordini a diversi livelli di prezzo.
- Lacune di liquidità
Le lacune di liquidità sono gap o aree su un grafico dei prezzi dove manca l'attività di trading. Queste lacune rappresentano zone con ordini di acquisto o vendita minimi o assenti, spesso causando movimenti di prezzo bruschi quando il mercato entra in queste aree.
In sintesi, le lacune di liquidità sono aree cruciali su un grafico dei prezzi caratterizzate da una mancanza di attività di trading. Queste lacune possono portare a rapidi movimenti di prezzo e a una maggiore volatilità, rendendole considerazioni essenziali per i trader nella loro analisi e nei processi decisionali.
- Punti di oscillazione
I punti di inversione del prezzo sono comunemente chiamati punti di oscillazione. I trader spesso analizzano i punti di oscillazione storici per discernere le tendenze di mercato e individuare potenziali punti di ingresso e uscita dal trading.
Si noti che in questo script questi sono soggetti a back painting, cioè non sono localizzati dove vengono rilevati.
La rilevazione dei punti di oscillazione e la caratteristica unica di questo script si basano esclusivamente sull'azione del prezzo, eliminando la necessità di impostazioni numeriche definite dall'utente. Il processo inizia con la rilevazione dei punti di oscillazione a breve termine:
- Massimo di oscillazione a breve termine (STH): Identificato come un picco di prezzo circondato da massimi inferiori su entrambi i lati.
- Minimo di oscillazione a breve termine (STL): Riconosciuto come un minimo di prezzo circondato da minimi più alti su entrambi i lati.
I punti di oscillazione a medio e lungo termine sono rilevati utilizzando lo stesso approccio ma con una leggera modifica. Invece di analizzare direttamente le candele di prezzo, vengono utilizzati i punti di oscillazione a breve termine precedentemente rilevati. Per i punti di oscillazione a medio termine, vengono analizzati i punti a breve termine, mentre per quelli a lungo termine si utilizzano quelli a medio termine.
Questo metodo garantisce un'analisi robusta e obiettiva delle dinamiche di mercato, offrendo ai trader informazioni affidabili sulle strutture di mercato. I punti di oscillazione rilevati servono come base per identificare strutture di mercato, livelli di liquidità dal lato acquisto/vendita e order e breaker blocks presentati con questo strumento.
In sintesi, i punti di oscillazione sono elementi essenziali nell'analisi tecnica, aiutando i trader a identificare tendenze, livelli di supporto e resistenza e punti ottimali di ingresso e uscita. Comprendere i punti di oscillazione permette ai trader di prendere decisioni informate basate sui movimenti naturali del prezzo nel mercato.
Impostazioni
- Strutture di mercato
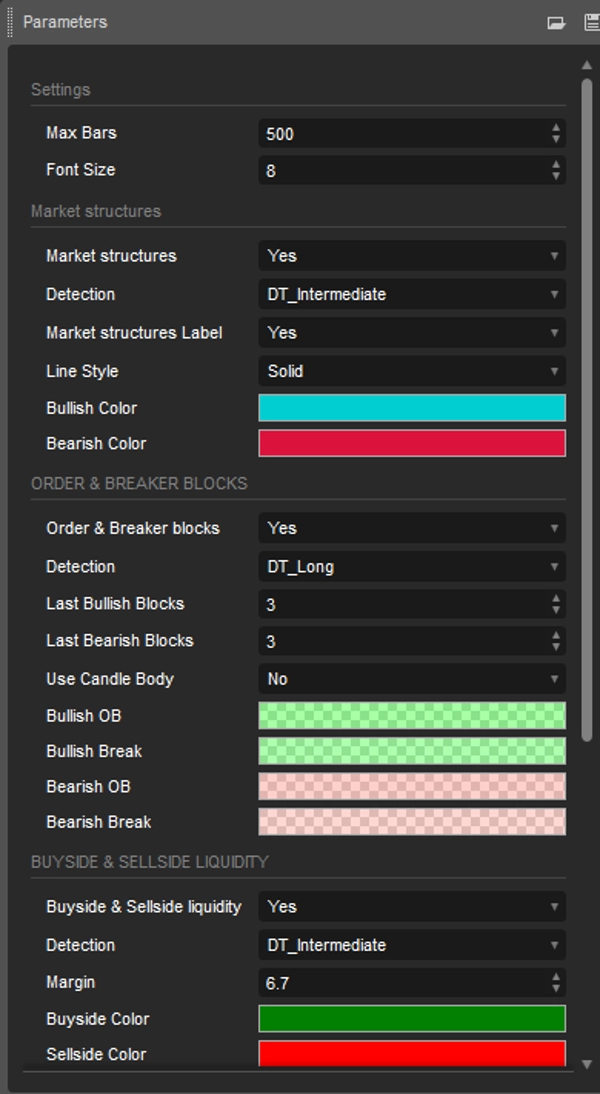
Strutture di mercato: Attiva o disattiva la visibilità delle strutture di mercato, sia shift che break.
Rilevazione: Un'opzione che consente agli utenti di rilevare le strutture di mercato basate sull'importanza dei livelli di oscillazione, inclusi quelli a breve, medio e lungo termine.
Etichette della struttura di mercato: Controlla la visibilità delle etichette che evidenziano il tipo di struttura di mercato.
Stile della linea: Personalizza lo stile delle linee che rappresentano la struttura di mercato.
- Order & Breaker Blocks
Order & Breaker Blocks: Attiva o disattiva la visibilità degli order & breaker blocks.
Rilevazione: Un'opzione che consente agli utenti di rilevare order & breaker blocks basati sull'importanza dei livelli di oscillazione, inclusi quelli a breve, medio e lungo termine.
Ultimi blocchi rialzisti: Numero degli order/breaker blocks rialzisti più recenti da visualizzare sul grafico.
Ultimi blocchi ribassisti: Numero degli order/breaker blocks ribassisti più recenti da visualizzare sul grafico.
Usa corpo candela: Consente agli utenti di utilizzare i corpi delle candele come aree di order block invece dell'intero intervallo della candela.
- Liquidità dal lato acquisto e dal lato vendita
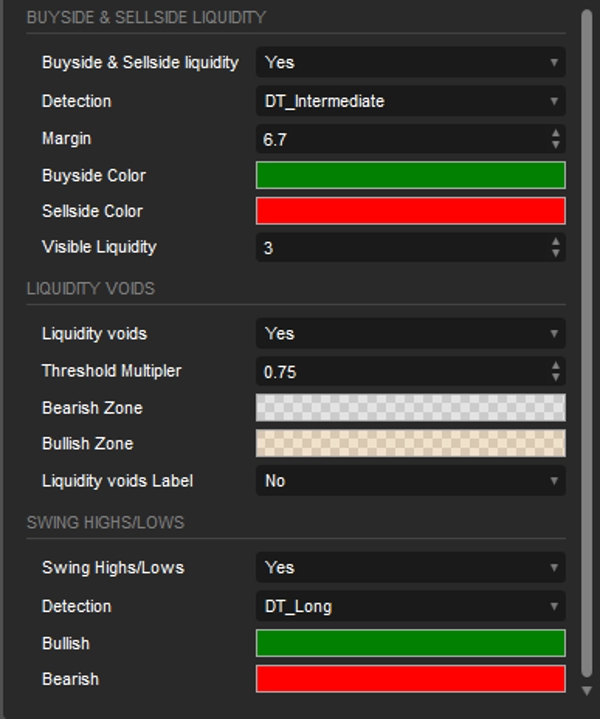
Liquidità dal lato acquisto e dal lato vendita: Attiva o disattiva la visibilità dei livelli di liquidità dal lato acquisto e dal lato vendita.
Rilevazione: Un'opzione che consente agli utenti di rilevare la liquidità dal lato acquisto e dal lato vendita basata sull'importanza dei livelli di oscillazione, inclusi quelli a breve, medio e lungo termine.
Margine: Imposta il margine/sensibilità per la rilevazione di un livello di liquidità.
Liquidità visibile: Controlla la quantità di livelli/zone di liquidità da visualizzare.
- Lacune di liquidità
Lacune di liquidità: Abilita la visualizzazione sia delle lacune di liquidità rialziste che ribassiste.
Moltiplicatore della soglia: Definisce il moltiplicatore per la soglia, che è codificato rigidamente sull'intervallo ATR a 200 periodi.
Etichetta: Abilita la visualizzazione di un'etichetta che indica le lacune di liquidità.
- Punti di oscillazione
Massimi/Minimi di oscillazione: Attiva o disattiva la visibilità dei livelli di oscillazione.
Rilevazione: Un'opzione che consente agli utenti di rilevare i livelli di oscillazione basati sull'importanza dei livelli di oscillazione, inclusi quelli a breve, medio e lungo termine.
Riepilogo
Key functionalities include:
- Market Structures: Detects Market Structure Shifts (potential trend reversals) and Breaks of Structure (trend continuations) based on price patterns.
- Order & Breaker Blocks: Highlights significant price zones where institutional buying/selling or strong reversals occur.
- Buy-side & Sell-side Liquidity: Identifies zones of concentrated buying or selling interest that may influence price movements.
- Liquidity Voids: Marks price chart gaps with minimal trading activity, often leading to sharp price moves.
- Swing Points: Detects short-, intermediate-, and long-term reversal points to aid in trend analysis and trade decision-making.
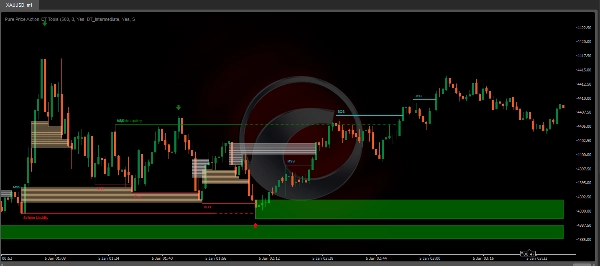
The tool offers customizable settings to toggle visibility and detection sensitivity for each feature, including options to adjust detection based on swing level significance and display preferences. It supports analysis across various markets such as Forex, Crypto (e.g., BTCUSD), and indices (e.g., NAS100, XAUUSD). The indicator provides an objective framework for analyzing market dynamics based solely on price action patterns.
Recensioni dei clienti
5 | 67 % | |
4 | 0 % | |
3 | 33 % | |
2 | 0 % | |
1 | 0 % |


![Logo di "[Hamster-Coder] Pivot Points MTF"](https://cdn.ctrader.com/image/webp/4c143e5a-309c-40e3-a578-f04d1e133ffa_31159)


![Logo di "[Hamster-Coder] Moving Average MTF"](https://cdn.ctrader.com/image/webp/b11b98b1-194d-4b8e-b00e-d611826ad159_31226)
