


Descrizione
#### Caratteristiche
- **Intervallo di tempo personalizzabile**: Gli utenti possono selezionare un intervallo di tempo specifico (ad esempio, giornaliero) per analizzare i livelli di apertura. Non impostare alcun TF < 1H.
- **Periodo di analisi storica**: L'indicatore supporta un periodo di analisi storica, consentendo ai trader di concentrarsi sull'azione dei prezzi recente e identificare punti di interesse rilevanti.
- **Linee di tendenza dinamiche**: Disegna linee di tendenza per indicare il prezzo di apertura dell'intervallo di tempo selezionato, fornendo chiari segnali visivi per potenziali livelli di supporto e resistenza.
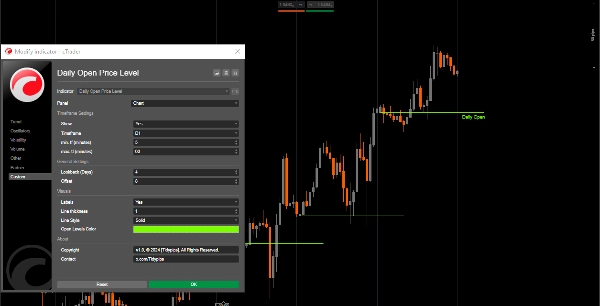
- **Opzioni di etichettatura**: I trader possono abilitare le etichette per visualizzare il prezzo di apertura direttamente sul grafico, migliorando chiarezza e comprensione.
- **Personalizzazione visiva**: Gli utenti possono personalizzare colori, stili e spessori delle linee per adattarli alle proprie preferenze e migliorare la leggibilità del grafico.
- **Restrizioni sull'intervallo di tempo**: L'indicatore include controlli per assicurarsi che operi solo entro le impostazioni minime e massime dell'intervallo di tempo specificate, evitando segnali fuorvianti.
#### Tutorial
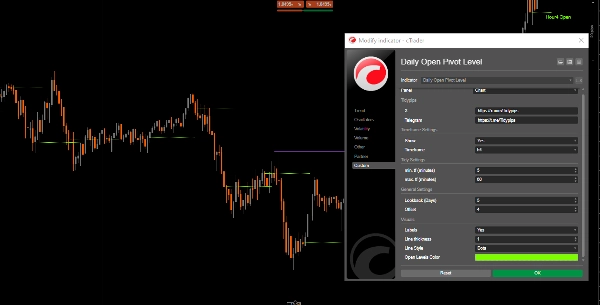
1. **Configurazione**: Apri le impostazioni dell'indicatore per selezionare l'intervallo di tempo desiderato, il periodo di analisi storica e personalizzare i parametri visivi come colore e spessore della linea.
2. **Utilizzo dell'indicatore**: Una volta applicato, l'indicatore traccerà automaticamente i livelli di prezzo di apertura sul tuo grafico in base alle impostazioni specificate.
3. **Analisi**: Osserva i livelli tracciati mentre fai trading. Usa questi livelli per identificare potenziali zone di supporto e resistenza e prendere decisioni di trading informate.
#### Strumenti consigliati in abbinamento
- **cTrader**: La piattaforma nativa per cAlgo, che offre un'esperienza fluida per l'uso e la personalizzazione degli indicatori.
- **Strumenti di analisi tecnica**: Combina questo indicatore con altri strumenti come medie mobili o oscillatori per migliorare la tua strategia di trading e l'analisi di mercato.
- **Strumenti di gestione del rischio**: Utilizza calcolatori della dimensione della posizione e strumenti di stop-loss per gestire efficacemente il rischio durante il trading intorno ai livelli di apertura identificati.
Integrando l'indicatore Daily Open Pivot Level con questi strumenti, i trader possono migliorare la loro analisi di mercato e aumentare le probabilità di successo nel navigare le complessità del trading intraday.
Riepilogo
Recensioni dei clienti
5 | 100 % | |
4 | 0 % | |
3 | 0 % | |
2 | 0 % | |
1 | 0 % |


