

Descripción
Esta herramienta permite a los usuarios especificar un marco temporal para el análisis, como diario, y trazar los niveles altos y bajos en sus gráficos con colores, estilos y grosores personalizables. Soporta múltiples días anteriores, facilitando la identificación de zonas significativas de acción del precio. El indicador también cuenta con etiquetas opcionales para mayor claridad, ayudando a los traders a tomar decisiones informadas basadas en datos históricos de precios. Ideal tanto para traders novatos como experimentados, esta herramienta mejora el análisis del mercado y las estrategias de trading.
Características
Marco Temporal Personalizable: Los usuarios pueden seleccionar un marco temporal específico (por ejemplo, diario) para analizar los máximos y mínimos anteriores, permitiendo una visualización adaptada que se ajuste a sus estrategias de trading.
Múltiples Días Anteriores: La capacidad de trazar niveles altos y bajos para varios días anteriores proporciona una vista completa de las zonas significativas de acción del precio.
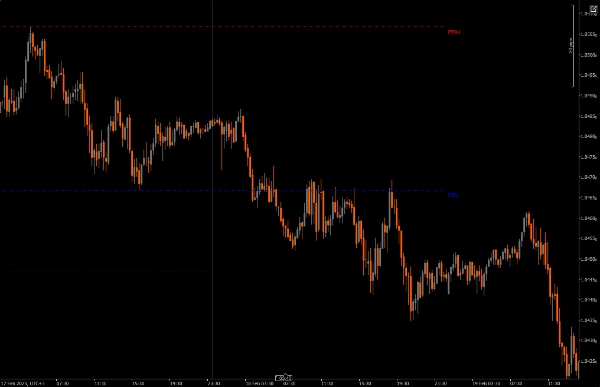
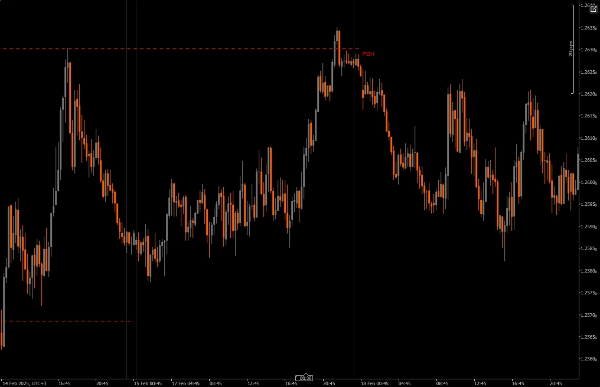
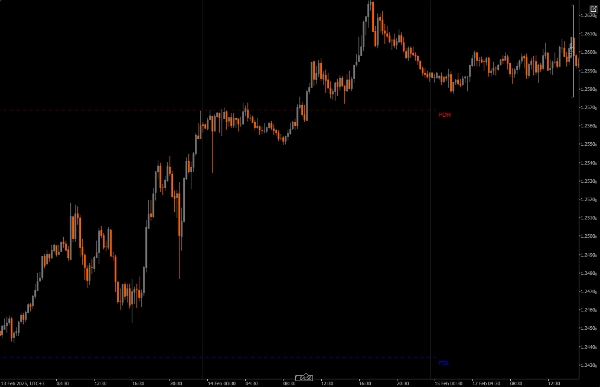
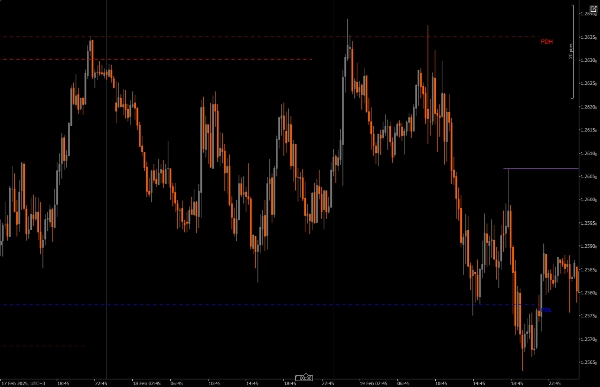
Líneas de Tendencia Dinámicas: El indicador dibuja líneas de tendencia para el máximo y mínimo del día anterior, facilitando la identificación rápida de posibles zonas de reversión.
Opciones de Etiquetado: Los usuarios pueden activar etiquetas para mostrar los valores actuales de máximo y mínimo directamente en el gráfico, mejorando la claridad y comprensión.
Personalización Visual: Los traders pueden personalizar los colores, estilos y grosores de las líneas para adaptarlos a sus preferencias y mejorar la legibilidad del gráfico.
Restricciones de Marco Temporal: El indicador asegura que opere solo dentro de los ajustes mínimos y máximos de marco temporal especificados, reduciendo la cantidad de desorden en el gráfico al cambiar entre otros marcos temporales.
Puntos a Tener en Cuenta
PDH o PDL en el mercado pueden usarse como un punto de liquidez (DOL) o para enmarcar una reversión.
Las reversiones pueden enmarcarse a partir de PDH y PDL cuando hay una falla para desplazar.
Cuando el precio respeta una serie PD por encima o por debajo, y falla en desplazar sobre un nivel alto o bajo diario, se puede anticipar la siguiente vela.
¿Es más probable que el precio alcance el máximo o mínimo del día anterior? Al usar PDH PDL como un punto de liquidez (DOL)
Instalación: Descargue e instale las Zonas de Liquidez de Rango Diario (PDH PDL) en su plataforma cAlgo.
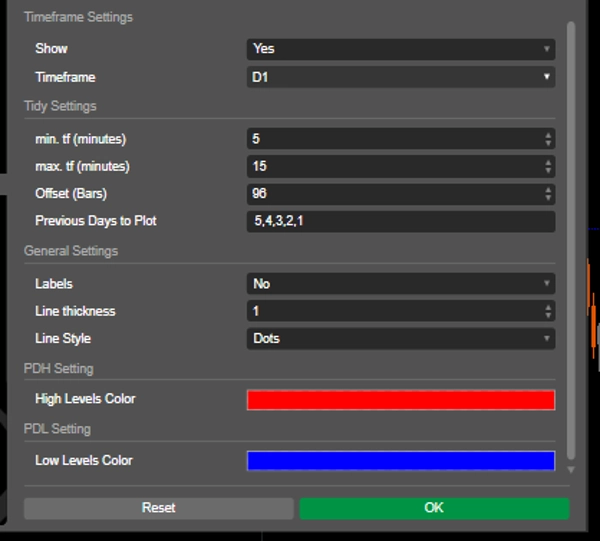
Configuración: Abra la configuración del indicador y seleccione el marco temporal deseado para el análisis, el número de días anteriores a trazar y personalice parámetros visuales como el color y grosor de las líneas.
Uso del Indicador: El indicador trazará automáticamente los niveles altos y bajos del día anterior en su gráfico según la configuración especificada.
Análisis: Observe los niveles trazados mientras opera. Use estos niveles para enmarcar posibles reversiones y tomar decisiones de trading informadas.
Herramientas Complementarias Recomendadas
cTrader: La plataforma nativa para cAlgo, que proporciona un entorno fluido para usar y personalizar indicadores.
Herramientas de Análisis Técnico: Combine este indicador con otras herramientas como Fair Value Gaps (FVG) e Indicadores de Patrones de Reversión (CRT) para mejorar su estrategia de trading y análisis de mercado.
Herramientas de Gestión de Riesgos: Utilice calculadoras de tamaño de posición y herramientas de stop-loss para gestionar eficazmente el riesgo al operar alrededor de los niveles altos y bajos identificados.
Al integrar las Zonas de Liquidez de Rango Diario (PDH PDL) con estas herramientas, los traders pueden mejorar su análisis de mercado y aumentar sus posibilidades de éxito al navegar las complejidades de la acción del precio.
Resumen
Valoraciones de clientes
5 | 100 % | |
4 | 0 % | |
3 | 0 % | |
2 | 0 % | |
1 | 0 % |


