Renko Moving Average Cross Indicator
Indikator
623 muat turun
Versi 1.0, Aug 2025
Windows, Mac
5.0
Ulasan: 1
Sejak 21/02/2025
466.3M
Volum yang didagangkan
180.83K
Pip dimenangi
22
Jualan
6.89K
Pemasangan percuma
Penerangan
***Penunjuk jarang menghasilkan isyarat dengan tetapan lalai, tetapi ini sangat berharga!***
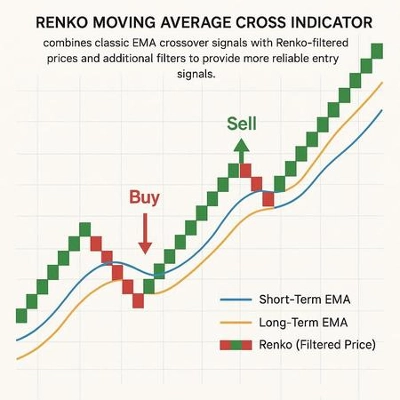
Penunjuk Renko Moving Average Cross menggabungkan isyarat persilangan EMA klasik dengan harga yang ditapis Renko dan penapis tambahan untuk memberikan isyarat kemasukan yang lebih boleh dipercayai.
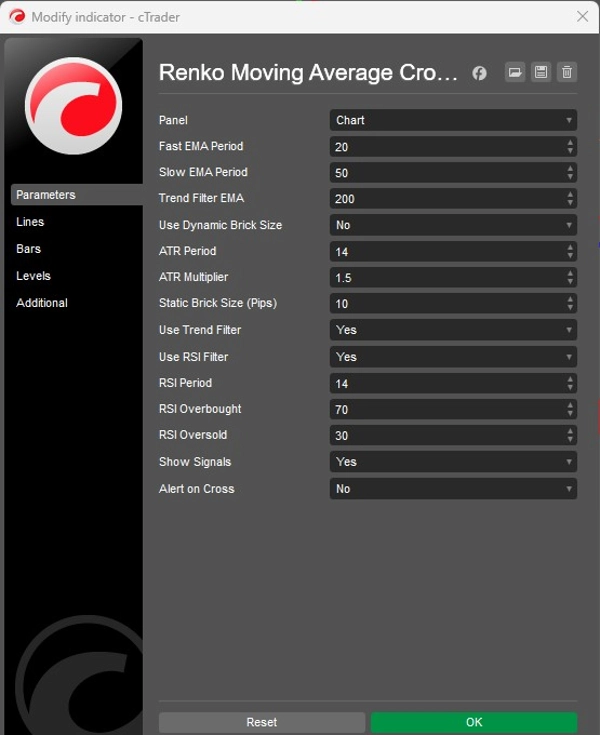
- Penapisan Renko: Melicinkan tindakan harga menggunakan saiz batu bata statik atau dinamik (berdasarkan ATR).
- Persilangan EMA: Menghasilkan isyarat apabila EMA pantas melintasi di atas atau di bawah EMA perlahan.
- Penapis Trend: EMA 200 pilihan untuk mengesahkan arah trend keseluruhan.
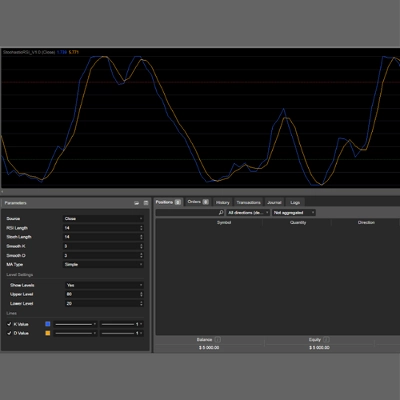
- Penapis RSI: Menghalang isyarat dalam keadaan terlebih beli atau terlebih jual.
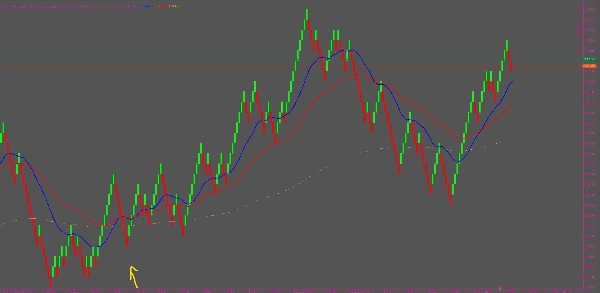
- Paparan Isyarat: Anak panah beli dan jual dipaparkan terus pada carta, dengan amaran pilihan.
👉 Matlamat: Untuk mengenal pasti isyarat mengikuti trend yang berkualiti lebih tinggi sambil mengurangkan bunyi pasaran.
Ringkasan
Ringkasan AI
The Renko Moving Average Cross indicator integrates classic exponential moving average (EMA) crossover signals with Renko-filtered price data to enhance signal reliability. It smooths price action using static or dynamic (ATR-based) Renko brick sizes, reducing market noise. Signals are generated when a fast EMA crosses above or below a slow EMA, indicating potential buy or sell opportunities. Additional filters include an optional 200 EMA trend filter to confirm overall market direction and an RSI filter to avoid signals during overbought or oversold conditions. Buy and sell signals are displayed directly on the chart as arrows, with optional alert notifications. The indicator aims to identify higher-quality trend-following signals by combining multiple technical tools and filters.
Profil indikator
Ulasan pelanggan
5.0
Ulasan: 1
5 | 100 % | |
4 | 0 % | |
3 | 0 % | |
2 | 0 % | |
1 | 0 % |
Perbincangan
Soalan Lazim
Produk yang tersedia melalui cTrader Store, termasuk bot dagangan, indikator dan plugin, disediakan oleh pembangun pihak ketiga dan diberikan akses untuk tujuan maklumat dan teknikal sahaja. cTrader Store bukan broker dan tidak memberikan nasihat pelaburan, syor peribadi atau sebarang jaminan prestasi masa hadapan.


Harga
Sejak 21/02/2025
466.3M
Volum yang didagangkan
180.83K
Pip dimenangi
22
Jualan
6.89K
Pemasangan percuma