
Rsi + Volume
Indicatore
707 download
Versione 1.0, Mar 2025
Windows, Mac
5.0
Recensioni: 3
Da 21/02/2025
466.3M
Volume negoziato
180.83K
Profitto in pip
22
Vendite
6.82K
Installazioni gratuite
Descrizione
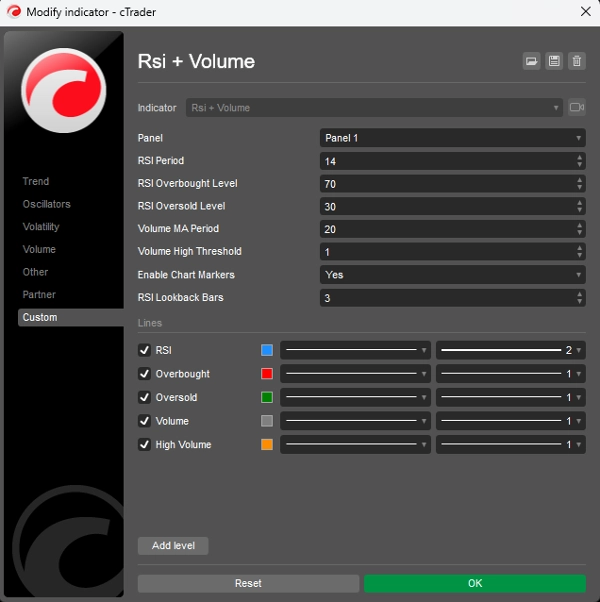
Questo indicatore combina l'RSI (Relative Strength Index) con l'analisi del volume per generare segnali di trading più affidabili. Funziona sul principio che movimenti di prezzo significativi dovrebbero essere accompagnati da un alto volume per confermare la forza del movimento.
Componenti Chiave:
- Analisi RSI:
-
- Misura la velocità e il cambiamento dei movimenti di prezzo su una scala da 0 a 100
- Identifica condizioni di ipercomprato (sopra 70) e ipervenduto (sotto 30)
- Aiuta a individuare potenziali punti di inversione nel mercato
- Analisi del Volume:
-
- Confronta il volume attuale con una media mobile del volume recente
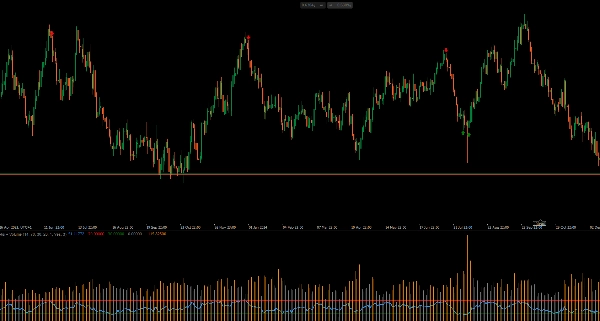
- Evidenzia i periodi di alto volume (barre dell'istogramma arancioni)
- Conferma la forza dietro i movimenti di prezzo
- Generazione del Segnale:
-
- Segnale di Acquisto: Quando l'RSI supera il livello di ipervenduto (30) con alto volume
- Segnale di Vendita: Quando l'RSI scende sotto il livello di ipercomprato (70) con alto volume
- I segnali visivi appaiono direttamente sul grafico (frecce verdi verso l'alto per l'acquisto, frecce rosse verso il basso per la vendita)
Come Usarlo:
- Cerca segnali di acquisto quando il prezzo è in una tendenza al ribasso e l'RSI mostra condizioni di ipervenduto
- Cerca segnali di vendita quando il prezzo è in una tendenza al rialzo e l'RSI mostra condizioni di ipercomprato
- Un volume più alto conferma la forza del segnale
- Regola i parametri (periodo RSI, soglia del volume) per adattarli al tuo intervallo temporale di trading
Questo indicatore aiuta a filtrare i falsi segnali richiedendo sia la conferma dell'RSI che un volume superiore alla media, rendendolo più affidabile rispetto all'uso dell'RSI da solo.
Riepilogo
Riepilogo AI
The "Rsi + Volume" indicator integrates the Relative Strength Index (RSI) with volume analysis to enhance the reliability of trading signals. It operates on the principle that significant price movements should be confirmed by high trading volume.
Key components include:
1. RSI Analysis:
- Measures the speed and change of price movements on a 0-100 scale.
- Identifies overbought conditions (above 70) and oversold conditions (below 30).
- Helps detect potential market reversal points.
2. Volume Analysis:
- Compares current volume against a moving average of recent volume.
- Highlights periods of high volume using orange histogram bars.
- Confirms the strength behind price movements.
Signal generation occurs when RSI crosses key thresholds with accompanying high volume:
- Buy signals trigger when RSI rises above the oversold level (30) with high volume.
- Sell signals trigger when RSI falls below the overbought level (70) with high volume.
Visual signals appear directly on the chart as green up arrows for buys and red down arrows for sells.
Users can adjust parameters such as RSI period and volume threshold to fit their trading timeframe. This indicator aims to filter out false signals by requiring both RSI confirmation and above-average volume, providing more dependable trade signals than RSI alone.
Profilo indicatore
Recensioni dei clienti
5.0
Recensioni: 3
5 | 100 % | |
4 | 0 % | |
3 | 0 % | |
2 | 0 % | |
1 | 0 % |
Recensioni dei clienti
October 12, 2025
Hello, the RSI +volume indicator is perfect, but it needed to have something: when the little arrow appears on the chart, it could show a notification or an alarm. Would you be able to add that alarm or notification in cTrader?
August 12, 2025
Pros: Combines RSI and volume for stronger trading signals. Works well when RSI threshold intersects with high volume spikes. Lightweight and clear visuals. Cons: No alerts or tooltips. Lacks template saving. May generate noise on low-volume timeframes without additional filters.
Discussioni
Domande frequenti
Signal
Indices
RSI
I prodotti disponibili tramite cTrader Store, inclusi bot di trading, indicatori e plugin, sono forniti da sviluppatori terzi e resi disponibili esclusivamente a scopo informativo e di accesso tecnico. cTrader Store non è un broker e non fornisce consulenze in materia di investimento, raccomandazioni individualizzate o garanzie di risultati futuri.


![Logo di "[Hamster-Coder] Pivot Points (Demo)"](https://cdn.ctrader.com/image/webp/87b54299-8c73-4942-9207-4bc6db824811_31153)


Prezzo
Da 21/02/2025
466.3M
Volume negoziato
180.83K
Profitto in pip
22
Vendite
6.82K
Installazioni gratuite