
Descrizione
Indicatore di Rottura della Volatilità - Motore di Volatilità Hawkes
Questo indicatore è pensato per fornire contesto, non azioni di trading immediate. La componente di volatilità ti aiuta a capire quando le condizioni di mercato stanno cambiando - i periodi di bassa volatilità spesso precedono grandi movimenti, e i periodi di alta volatilità alla fine si esauriscono. La componente EWMA ti mantiene orientato con il trend in sviluppo e evidenzia quando il prezzo si allontana da esso.
Combina queste due prospettive - regime di volatilità e contesto di trend - con la tua metodologia di trading e giudizio. L'indicatore ti mostra l'ambiente - sei tu a decidere cosa fare al suo interno.
Versione 2.0
Aperto per aggiornamenti futuri
-----------------------------------------------------------------------------------------------------------------------------------------------------------------------
Panoramica
-----------------------------------------------------------------------------------------------------------------------------------------------------------------------
Questo indicatore combina due componenti distinte per aiutare i trader a identificare simultaneamente i regimi di volatilità e le condizioni di trend.
La prima componente utilizza un Processo di Hawkes per rilevare i cambiamenti nella volatilità di mercato. A differenza degli indicatori di volatilità tradizionali, non predice la direzione—segnala semplicemente quando il mercato sta passando da una compressione tranquilla a una volatilità attiva, o viceversa. Pensalo come un rilevatore di stato della volatilità: ti dice quando le cose si stanno riscaldando o raffreddando, ma non in quale direzione si muoverà il prezzo.
La seconda componente aggiunge un sistema doppio EWMA (Media Mobile Ponderata Esponenzialmente) che si sovrappone al tuo grafico dei prezzi. Questo ti dà il contesto del trend usando un crossover di medie mobili veloci e lente, con un ulteriore livello di colorazione delle candele per mostrare quando il prezzo diverge dal trend.
-----------------------------------------------------------------------------------------------------------------------------------------------------------------------
Come funziona
-----------------------------------------------------------------------------------------------------------------------------------------------------------------------
Rilevamento della Volatilità: L'indicatore utilizza il stimatore di Volatilità High-Low di Parkinson—un metodo più efficiente rispetto all'ATR standard perché usa l'intero intervallo della barra. Questa volatilità normalizzata alimenta un calcolo del Processo di Hawkes, che viene poi confrontato con soglie dinamiche basate su quantili.
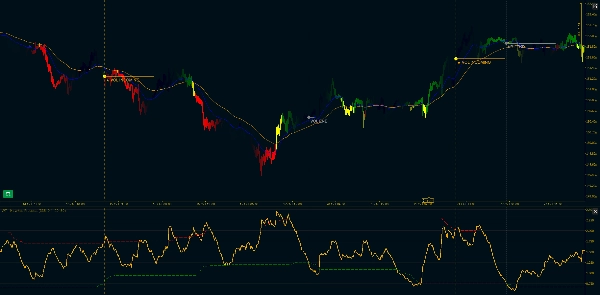
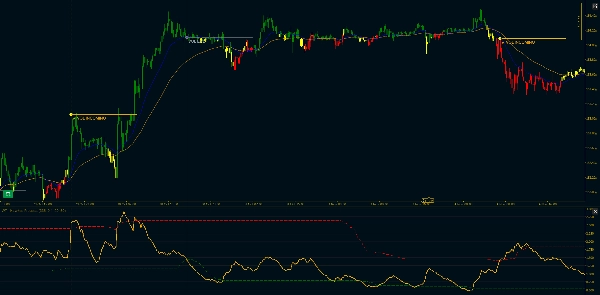
Quando la volatilità supera la soglia superiore dopo un periodo di compressione, ricevi un segnale "VOL INCOMING". Quando scende di nuovo sotto la soglia inferiore, vedi "VOL END". Questi non sono segnali di ingresso—sono cambiamenti di regime di volatilità. Il mercato si sta svegliando o andando a dormire.
Contesto del Trend: Due medie mobili ponderate esponenzialmente (Veloce e Lenta) appaiono sul tuo grafico principale. La MA Veloce è blu, la MA Lenta è arancione. Quando la Veloce è sopra la Lenta, il trend è rialzista. Quando la Veloce è sotto la Lenta, il trend è ribassista.
Il Filtro di Divergenza: Qui diventa interessante. A volte il prezzo si allontana significativamente dal trend. Quando l'intera candela (apertura, massimo, minimo, chiusura) è sotto la MA Veloce durante un trend rialzista, o sopra di essa durante un trend ribassista, la barra diventa gialla. Questo è un filtro rigoroso—se anche solo lo stoppino tocca la MA Veloce, mantiene il colore normale del trend.
Le barre gialle spesso appaiono durante ritracciamenti o punti di esaurimento, ma ricorda: non ti dicono cosa succederà dopo, solo che il prezzo si è temporaneamente separato dalla linea del trend.
-----------------------------------------------------------------------------------------------------------------------------------------------------------------------
Caratteristiche Principali
-----------------------------------------------------------------------------------------------------------------------------------------------------------------------
Componente Volatilità:
- Normalizzazione della Volatilità High-Low di Parkinson (più efficiente del metodo ATR standard)
- Calcolo del Processo di Hawkes con decadimento regolabile (parametro Kappa)
- Soglie dinamiche basate su quantili (percentili personalizzabili)
- Indicatori visivi: "VOL INCOMING" alle rotture di volatilità, "VOL END" alle compressioni
- Filtraggio di continuazione: viene marcata solo la prima rottura, non ogni picco
- Linee di trend orizzontali opzionali e marcatori verticali
Componente Trend EWMA:
- Calcolo EWMA compatibile con Pandas (formula adjust=True)
- Linee MA Veloce e Lenta visualizzate sul grafico principale dei prezzi
- Lunghezze di span personalizzabili (default: 20/50)
- Supporto per periodi minimi (sopprime l'output fino a dati sufficienti)
- Opzione Ignora NA per la gestione dei gap
- Sistema a tre colori per le candele: Verde (trend rialzista), Rosso (trend ribassista), Giallo (divergenza)
Opzioni di Personalizzazione:
- Periodo Parkinson (periodo di lookback per il calcolo della volatilità)
- Kappa di Hawkes (tasso di decadimento, influenza la sensibilità)
- Periodo di Lookback per i quantili
- Soglie di Volatilità Bassa e Alta (percentili)
- Interruttore di annualizzazione e lunghezza del segmento
- Span Veloce e Lento per le medie mobili
- Colori per Bullish, Bearish e Divergenza
- Lunghezza di estensione della linea di trend
- Mostra/nascondi marcatori verticali
----------------------------------------------------------------------------------------------------------------------------------------------------------------------------
Nota Tecnica: La componente del Processo di Hawkes utilizza un calcolo esponenziale ricorsivo ottimizzato per l'uso in tempo reale. L'implementazione EWMA corrisponde al comportamento di Pandas per coerenza con il backtesting basato su Python. Entrambe le componenti calcolano solo su barre chiuse per evitare repainting.
Riepilogo
Recensioni dei clienti
5 | 100 % | |
4 | 0 % | |
3 | 0 % | |
2 | 0 % | |
1 | 0 % |


