
Weis & Wyckoff System v2.0
지표
2.4K 다운로드
버전 1.1, Jan 2026
Windows, Mac
5.0
리뷰: 3
설명
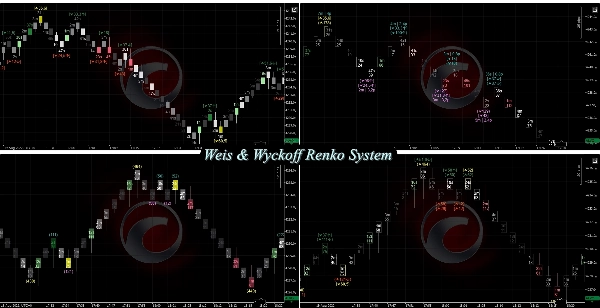
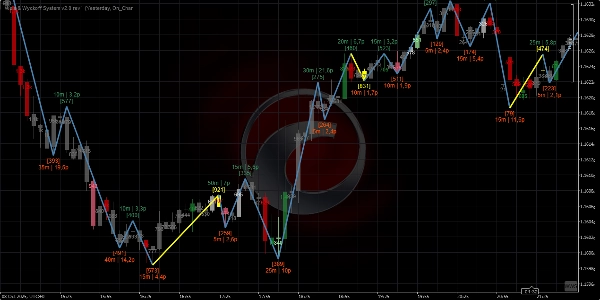
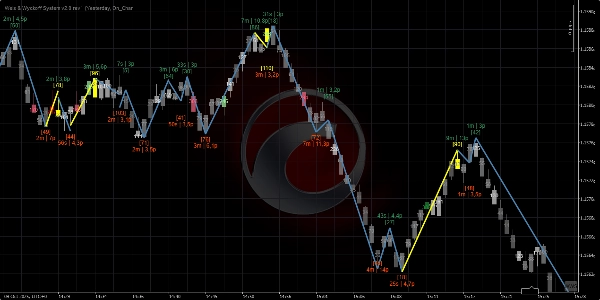
Weis & Wyckoff 시스템 이제 모든 차트를 지원합니다! [캔들, 틱, 렌코, 범위, 헤이킨-아시]
최종 설명 -> 11/11/2025
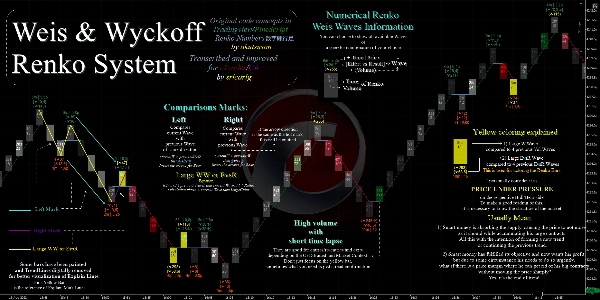
Weis & Wyckoff 시스템은 David H. Weis 와 Richard Wyckoff의 개념을 보여줍니다
Revision 1의 새로운 점은?
- [캔들, 헤이킨-아시, 틱, 범위] 차트 지원
- 개선된 ZigZag => MTF 지원 + [ATR, 백분율, 핍, NoLag_HighLow] 모드
- 모든 "주문 흐름 집계" 관련 개선사항 포함
-
- 사용자 정의 이동평균선(MA)
- 성능 향상 드로잉
- 강도 필터 (MA/표준편차/둘 다)
- 고성능 VP_Tick()
- 고성능 GetWicks()
- 비동기 틱 데이터 수집
- 수정 => MacOS에서의 파라미터 패널
==========================
이것은 단지 파동과 거래량을 수치적으로 시각화하는 방법일 뿐이며, 원래 아이디어는 아닙니다.
이 시각화 방법은 처음 다음에서 찾을 수 있습니다:
이것은 다음의 코드 개념을 사용합니다:
- (Numbers-Renko 数字練行足 in PineScript),
- 감사의 인사 akutsusho!께.
제가 개선했고 cTrader/C#로 옮겼습니다 그리고 이것은 무료/오픈소스입니다.
=========================================
cTrader/C#용으로 전사 및 개선됨
by srlcarlg
TradingView/Pinescript의 원본 코드 개념
by akutsusho
=========================================
항상 cTrader 스토어 버전을 우선 사용하세요, 그것이 가장 먼저 업데이트됩니다.
제가 개발한 모든 지표는 오픈 소스입니다. 코드에 접근할 수 없다면, Github 저장소를 확인하세요.
요약
AI 요약
Weis & Wyckoff System v2.0 is an open-source trading indicator for the cTrader platform that visualizes market waves and volume based on the concepts of David H. Weis and Richard Wyckoff. It supports multiple chart types including Candles, Heikin-Ashi, Tick, Range, and Renko charts. The system numerically displays wave patterns and volume dynamics to assist in market analysis.
Key features include:
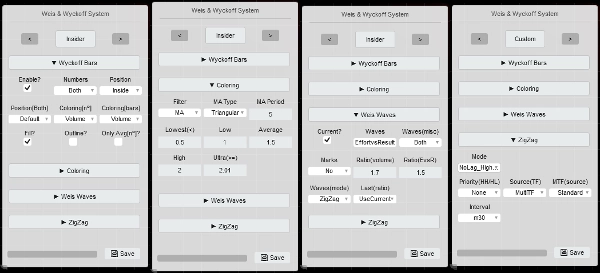
- A versatile Params Panel with four layout templates (Insider, Time, Volume, BigBrain) for quick and user-friendly customization.
- Enhanced ZigZag functionality with multi-timeframe support and multiple modes such as ATR, Percentage, Pips, and NoLag High/Low.
- Integration of order flow aggregation improvements, including custom moving averages, performance drawing, strength filters (MA, StdDev, or both), and high-performance tick volume and wick calculations.
- Dynamic TimeLapse feature showing time waves across various intervals from milliseconds to days.
- Compatibility with Mac OS and requires .NET 6.0 or higher.
The indicator is a C# adaptation and improvement of original PineScript concepts, designed to provide detailed wave and volume visualization without repainting options. It is maintained as open source, with code available on GitHub for transparency and further development.
Key features include:
- A versatile Params Panel with four layout templates (Insider, Time, Volume, BigBrain) for quick and user-friendly customization.
- Enhanced ZigZag functionality with multi-timeframe support and multiple modes such as ATR, Percentage, Pips, and NoLag High/Low.
- Integration of order flow aggregation improvements, including custom moving averages, performance drawing, strength filters (MA, StdDev, or both), and high-performance tick volume and wick calculations.
- Dynamic TimeLapse feature showing time waves across various intervals from milliseconds to days.
- Compatibility with Mac OS and requires .NET 6.0 or higher.
The indicator is a C# adaptation and improvement of original PineScript concepts, designed to provide detailed wave and volume visualization without repainting options. It is maintained as open source, with code available on GitHub for transparency and further development.
지표 프로필
고객 리뷰
5.0
리뷰: 3
5 | 100 % | |
4 | 0 % | |
3 | 0 % | |
2 | 0 % | |
1 | 0 % |
고객 리뷰
December 25, 2025
July 9, 2025
Pros: Visualizes wave structure and market phases using Renko and volume, following Wyckoff principles. Flexible settings, clear structure recognition. Cons: No tooltips or alerts. Requires Renko charts, less applicable on standard timeframes. Demands experience for interpretation.
May 13, 2025
its amazing indicator and thanks for coding this. Can you do this for range chart.
상담
자주 묻는 질문(FAQ)
ZigZag
VWAP
트레이딩 봇, 지표, 플러그인 등 cTrader Store에서 제공되는 상품은 제3자 개발자에 의해 제공되며, 이는 단순히 정보 및 기술적 접근을 목적으로 제공된 것입니다. cTrader Store는 중개인이 아니며, 투자 조언, 개인별 추천 또는 향후 성과에 대한 어떠한 보장도 제공하지 않습니다.


가격
가입일 12/12/2024
1
판매
33.44K
무료 설치