
설명
참고: cTrader Windows에서만 테스트되었습니다.
볼륨 프로필
가격 차트에 수직 프로필을 그려 어느 가격대에 더 많거나 적은 거래량(거래 관심)이 있는지 보여줍니다.
유연한 볼륨 프로필 지표
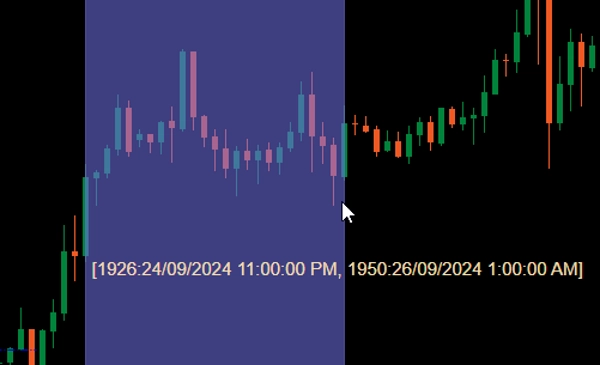
차트에 추가한 후, Ctrl 키를 누른 상태에서 가격 차트의 영역을 왼쪽 마우스로 드래그하면 해당 영역에 대한 프로필이 그려집니다.
성능을 위해 프로필은 두 가지 상태로 그려집니다:
- 거친 프로필: 지표는 CoarseTF(기본값 m5)로 정의된 시간 프레임을 사용하여 거래량 정보를 로드하며, 보통 빠릅니다. 거친 프로필이 표시되는 동안 세밀한 프로필은 백그라운드에서 로드됩니다.
- 세밀한 프로필: FineTF(기본값 m1)로 정의된 시간 프레임을 사용하는 더 정밀한 프로필이며, 최상세(t1 - 단일 틱)로 설정할 수도 있습니다. 그러나 일간 또는 더 긴 시간 프레임 차트를 보는 경우 틱 시간 프레임 설정은 로딩 시간을 증가시킵니다.
매개변수
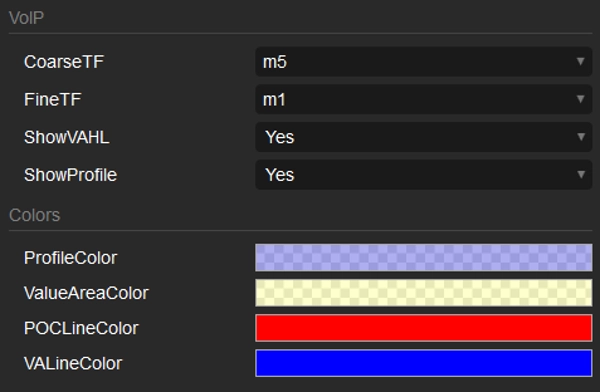
- CoarseTF: 거친 데이터의 시간 프레임(기본값 m5).
- FineTF: 세밀한 데이터의 시간 프레임(기본값 m1).
- ShowVAHL: VAH(가치 영역 최고)와 VAL(가치 영역 최저)을 표시합니다.
- ShowProfile: 예를 선택하면 전체 프로필을 표시하고, 그렇지 않으면 VAH, VAL 및 POC(통제점)만 표시합니다.
- Colors: 색상 사용자 지정.
사용 방법
지표를 가격 차트에 추가한 후, Ctrl 키를 누른 상태에서 왼쪽 마우스를 드래그하여 프로필을 생성할 영역을 선택하면 됩니다.
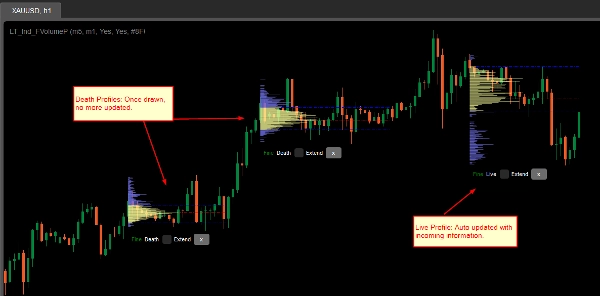
프로필이 렌더링된 후, 프로필 하단에서 다음과 같은 정보/조작을 볼 수 있습니다:
- 거친/세밀한: 프로필 상태.
- 죽음/실시간: 프로필이 최신 바(캔들)를 포함하면 실시간 프로필이며, 들어오는 정보로 자동 업데이트됩니다.
- 확장 체크박스: VAH, VAL 및 POC 선을 최신 바(캔들)까지 확장하려면 체크하세요.
- x 버튼: 차트에서 프로필을 제거하려면 클릭하세요.
요약
AI 요약
LT Flexible Volume Profile is a volume profile indicator designed for use on price charts, primarily tested on cTrader Windows. It visually represents trading volume distribution across price levels within a selected chart area, highlighting where trading interest is higher or lower.
Users activate the profile by holding Ctrl and dragging the mouse over a desired chart region. The indicator operates in two modes for performance optimization: a Coarse profile using a configurable timeframe (default 5 minutes) for faster loading, and a Fine profile using a finer timeframe (default 1 minute, with an option down to single ticks) for more precise volume data.
Key parameters include:
- CoarseTF and FineTF: timeframes for coarse and fine volume data aggregation.
- ShowVAHL: toggles display of Value Area High (VAH) and Value Area Low (VAL).
- ShowProfile: controls whether the full profile or only key levels (VAH, VAL, Point of Control) are shown.
- Colors: customizable color settings.
After rendering, the profile provides status indicators (Coarse/Fine, Live/Dead), options to extend VAH, VAL, and POC lines to the latest bar, and the ability to remove the profile. This tool supports detailed volume analysis to assist traders in identifying significant price levels based on traded volume.
지표 프로필
고객 리뷰
5.0
리뷰: 3
5 | 100 % | |
4 | 0 % | |
3 | 0 % | |
2 | 0 % | |
1 | 0 % |
고객 리뷰
October 1, 2024
Sensible product to test around volume based context. The useful part is checking participation, value areas and pressure, with the numbers checked before scaling. I would review 20 reactions near POC or VWAP before trusting the read. The data helps most when price action confirms the same zone.
September 30, 2024
September 30, 2024
Good tool for patience if the trader wants it adds useful information behind the price move. It works best as support, not a final decision maker. Volume context is stronger when POC, VWAP and value area agree across 2 sessions. volume alone can be noisy without price action.
상담
자주 묻는 질문(FAQ)
Forex
트레이딩 봇, 지표, 플러그인 등 cTrader Store에서 제공되는 상품은 제3자 개발자에 의해 제공되며, 이는 단순히 정보 및 기술적 접근을 목적으로 제공된 것입니다. cTrader Store는 중개인이 아니며, 투자 조언, 개인별 추천 또는 향후 성과에 대한 어떠한 보장도 제공하지 않습니다.


좋아하실 만한 다른 항목


가격
가입일 25/09/2024
34
판매