
설명
참고: cTrader Windows에서만 테스트되었습니다.
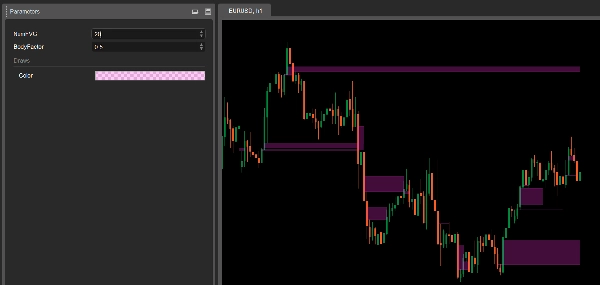
LT_FairValueGap 는 정밀한 가격 행동 트레이더를 위해 설계된 가볍고 강력한 공정 가치 격차 지표입니다. 엄격한 3봉 논리를 사용하여 기관 스타일의 불균형 구역을 강조하고 가격이 격차를 다시 방문하면 이를 제거하여 진입, 청산 또는 합류를 위한 깨끗하고 실행 가능한 구역을 제공합니다.
🔍 작동 원리
- 강한 중간 캔들(큰 몸통)이 두 인접 캔들 사이에 불균형을 만들 때 공정 가치 격차(FVG)가 식별됩니다.
- 격차는 임시 지지/저항 구역(SR)으로 표시됩니다.
- 가격이 돌아와 격차를 메우면, 구역은 더 이상 확장되지 않아 차트가 깔끔하고 관련성을 유지합니다.
⚙️ 매개변수
- NumFVG: 차트에 표시할 FVG 구역의 최대 수.
- BodyFactor: 중간 봉의 강도 임계값 (기본값:
2.0×최근 20봉의 평균 몸통).
✅ 주요 특징
- 기관 스타일의 격차 감지 (3봉 논리)
- 깔끔한 차트 — 구역은 한 번 도달하면 확장 중지
- BodyFactor를 통한 조절 가능한 민감도
- 플러그 앤 플레이: 최소한의 설정
📌 사용 사례
- 기관 불균형 및 반응 구역 식별
- 진입 합류 또는 무효화 표시기로 사용
- 스윙 구조 또는 거래량 도구와 결합
돌파, 완화 또는 반전을 거래하든, LT_FairValueGap 은 소음을 제거하고 중요한 진정한 불균형 구역을 찾는 데 도움을 줍니다.
요약
지표 프로필
고객 리뷰
5.0
리뷰: 1
5 | 100 % | |
4 | 0 % | |
3 | 0 % | |
2 | 0 % | |
1 | 0 % |
고객 리뷰
June 25, 2025
Ngl, market notes are quicker to compare and that is enough to keep testing it. It should not replace the chart.
상담
자주 묻는 질문(FAQ)
Forex
트레이딩 봇, 지표, 플러그인 등 cTrader Store에서 제공되는 상품은 제3자 개발자에 의해 제공되며, 이는 단순히 정보 및 기술적 접근을 목적으로 제공된 것입니다. cTrader Store는 중개인이 아니며, 투자 조언, 개인별 추천 또는 향후 성과에 대한 어떠한 보장도 제공하지 않습니다.


!["[CB] Pivot Points Pro" 로고](https://cdn.ctrader.com/image/webp/43463c82-67b0-4f10-a4ba-901bba091d81_32594)
!["Gaussian Channel [Iridio Capital]" 로고](https://cdn.ctrader.com/image/webp/7c039209-5573-4a54-a072-f9528b503103_41960)


!["[Stellar Strategies] MARSI Signal Plotter" 로고](https://cdn.ctrader.com/image/webp/7b2b8da6-8f8e-4646-8d4a-4710c516c01e_25567)


가격
가입일 25/09/2024
34
판매