
설명
참고: cTrader Windows에서만 테스트되었습니다.
LT_Ind_VWAP는 cTrader용 실용적인 고정 VWAP 지표입니다.
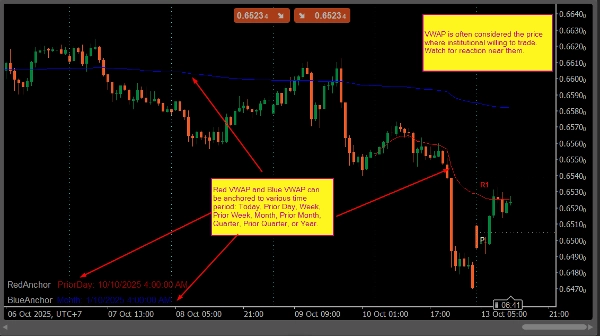
두 개의 VWAP 라인(빨간색과 파란색)을 그리며, 각각을 오늘, 전일, 주, 전주, 월, 전월, 분기, 전분기 또는 연도와 같은 선택된 기간에 고정할 수 있습니다.
이 지표는 새로운 날이 시작될 때 자동으로 재계산되며, 활성 고정 지점과 날짜를 차트에 직접 표시합니다. VWAP 수준을 사용하여 공정 가치, 추세 편향 또는 평균 회귀 영역을 추적하는 트레이더를 위해 설계되었습니다.
주요 특징
- 독립적인 고정 지점을 가진 두 개의 VWAP 라인
- 지원되는 고정 지점: 오늘, 전일, 주, 전주, 월, 전월, 분기, 전분기, 연도
- 세션 변경 시 자동 재계산
- 차트에 표시되는 고정 정보
- 간단한 설정, 최소한의 리소스 사용
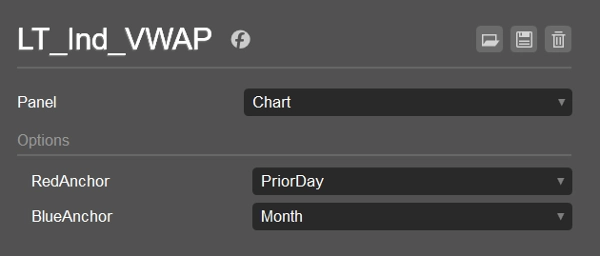
기본 설정
- 빨간색 VWAP: 전일
- 파란색 VWAP: 월
사용 사례
- 일중 가격과 전일 VWAP 비교
- 스윙 편향을 위한 월간 또는 분기별 VWAP 모니터링
- 단기 및 장기 VWAP 수준 간의 일치점 찾기
요약
AI 요약
LT_Ind_VWAP is an anchored VWAP (Volume Weighted Average Price) indicator designed for the cTrader platform (Windows version). It displays two independent VWAP lines—red and blue—each anchored to selectable time periods including Today, Prior Day, Week, Prior Week, Month, Prior Month, Quarter, Prior Quarter, or Year. The indicator automatically recalculates at the start of a new trading session and shows the active anchor and date on the chart for easy reference. Its primary use cases include comparing intraday prices with prior-day VWAP, monitoring monthly or quarterly VWAP for swing trading bias, and identifying confluence between short- and long-term VWAP levels. The default settings anchor the red VWAP to the prior day and the blue VWAP to the current month. LT_Ind_VWAP offers a simple setup with minimal resource consumption, making it suitable for traders who rely on VWAP levels to assess fair value, trend direction, or mean-reversion zones across various markets such as Forex, indices, commodities, cryptocurrencies, and stocks.
지표 프로필
고객 리뷰
4.5
리뷰: 2
5 | 50 % | |
4 | 50 % | |
3 | 0 % | |
2 | 0 % | |
1 | 0 % |
고객 리뷰
October 26, 2025
상담
자주 묻는 질문(FAQ)
Prop
Forex
Indices
Commodities
Crypto
Stocks
VWAP
트레이딩 봇, 지표, 플러그인 등 cTrader Store에서 제공되는 상품은 제3자 개발자에 의해 제공되며, 이는 단순히 정보 및 기술적 접근을 목적으로 제공된 것입니다. cTrader Store는 중개인이 아니며, 투자 조언, 개인별 추천 또는 향후 성과에 대한 어떠한 보장도 제공하지 않습니다.


가격
가입일 25/09/2024
34
판매