
설명
참고: cTrader Windows에서만 테스트되었습니다.
LT_Ind_Pivot는 여러 시간대에 걸쳐 주요 시장 수준과 세션 구조를 시각화하는 데 도움이 되는 강력하고 사용자 정의 가능한 cTrader용 피벗 포인트 지표입니다.
선택한 앵커 시간대를 기준으로 피벗(P), 서포트(S1–S5), 레지스턴스(R1–R5), 및 CPR(TC/BC) 수준을 자동으로 계산하고 표시합니다 — H1, H4, H8, H12, D1, W1, Month1까지.
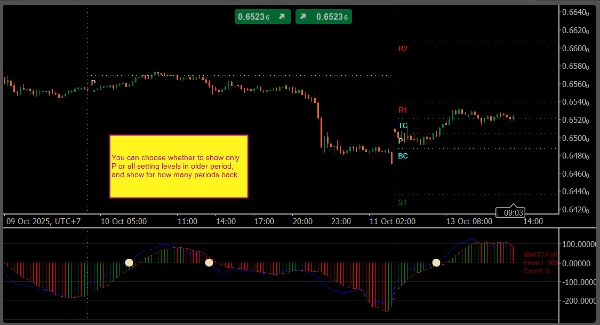
이 지표는 또한 수직 구분선을 각 앵커 기간마다 메인 차트와 지표 패널에 그려 세션 또는 기간 경계를 쉽게 구분할 수 있게 합니다.
다음과 같은 유연한 표기법을 사용하여 표시할 수준을 정확히 정의할 수 있습니다:
P, S1, R1– 표준 수준PS1,S1S2,R1R2등 – 피벗과 주요 서포트/레지스턴스 사이의 중간 수준TC,BC– 중앙 피벗 범위(CPR)
디스플레이 컨트롤을 통해 표시할 과거 피벗 수, 텍스트/가격 레이블 표시 여부, 각 수준의 색상 및 스타일을 설정할 수 있습니다.
주요 기능
- 피벗 앵커: H1, H4, H8, H12, D1, W1, Month1
- 사용자 정의 수준 구문:
P, Sx, Rx, PS1, S1S2, R1R2, TC, BC - 차트 및 지표 패널의 수직 기간 구분선
- 텍스트, 가격 및 이전 피벗 수준 표시 옵션
- 완전한 색상 및 선 스타일 사용자 정의
- 가볍고 실시간 거래에 적합
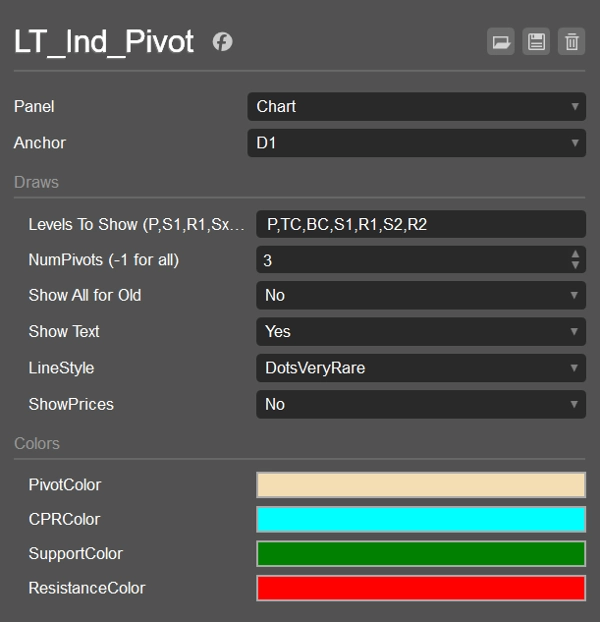
기본 설정
- 앵커: D1
- 표시 수준:
P,S1,R1 - NumPivotsBack: 1
- ShowAllForOldPivots: false
- 텍스트 표시: true
- 가격 표시: false
- 선 스타일: Solid
- 색상: 피벗 = 밀색, CPR = 시안, 서포트 = 녹색, 레지스턴스 = 빨강
사용 사례
- 일중 및 스윙 서포트/레지스턴스 구역 표시
- 돌파 또는 평균회귀 설정을 위한 CPR 및 중간 수준 추적
- 세션별 구조 분석을 위한 기간 구분선 사용
- 더 높은 일치도를 위해 VWAP 또는 스윙 지표와 결합
요약
지표 프로필
고객 리뷰
4.0
리뷰: 1
5 | 0 % | |
4 | 100 % | |
3 | 0 % | |
2 | 0 % | |
1 | 0 % |
고객 리뷰
October 26, 2025
Demo first, then maybe small size if the notes look sane, and It needs a boring test before bigger size.
상담
자주 묻는 질문(FAQ)
Prop
Forex
Indices
Commodities
Crypto
Stocks
트레이딩 봇, 지표, 플러그인 등 cTrader Store에서 제공되는 상품은 제3자 개발자에 의해 제공되며, 이는 단순히 정보 및 기술적 접근을 목적으로 제공된 것입니다. cTrader Store는 중개인이 아니며, 투자 조언, 개인별 추천 또는 향후 성과에 대한 어떠한 보장도 제공하지 않습니다.


좋아하실 만한 다른 항목


가격
가입일 25/09/2024
34
판매