


Mô tả
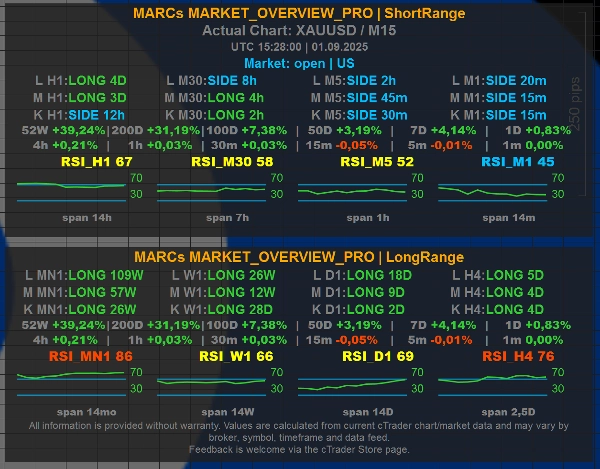
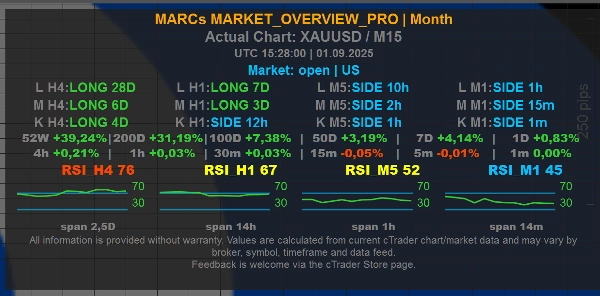
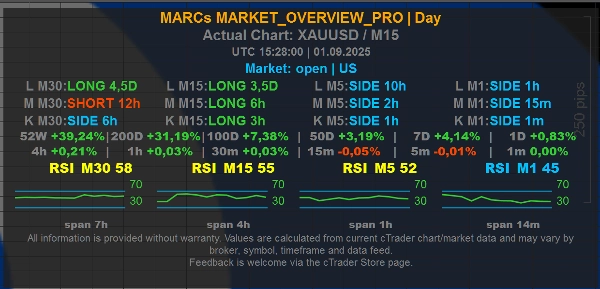
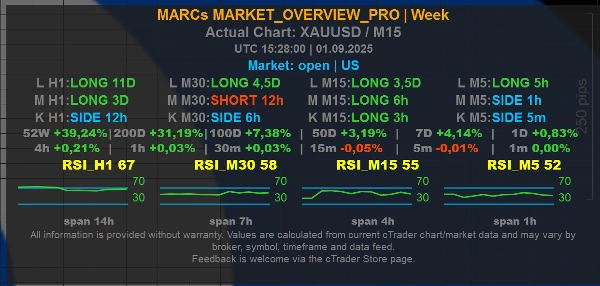
MARCs MARKET_OVERVIEW_Pro là một chỉ báo tổng quan thị trường đa khung thời gian dành cho cTrader.
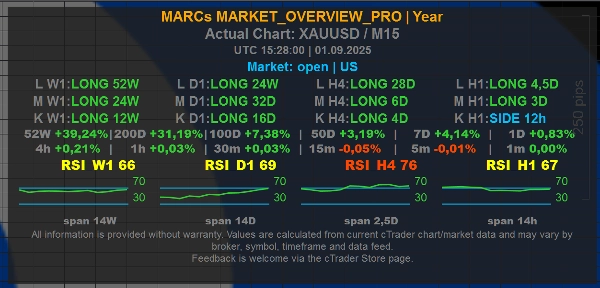
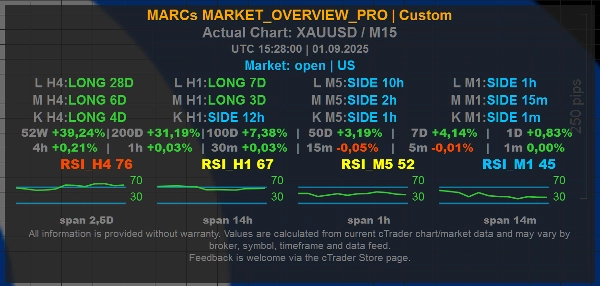
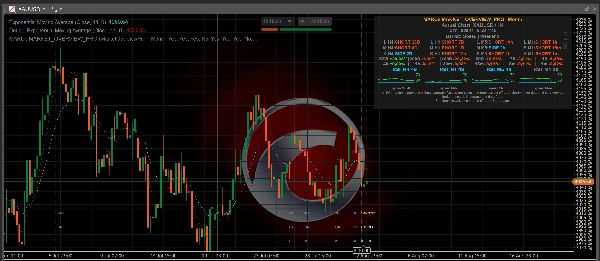
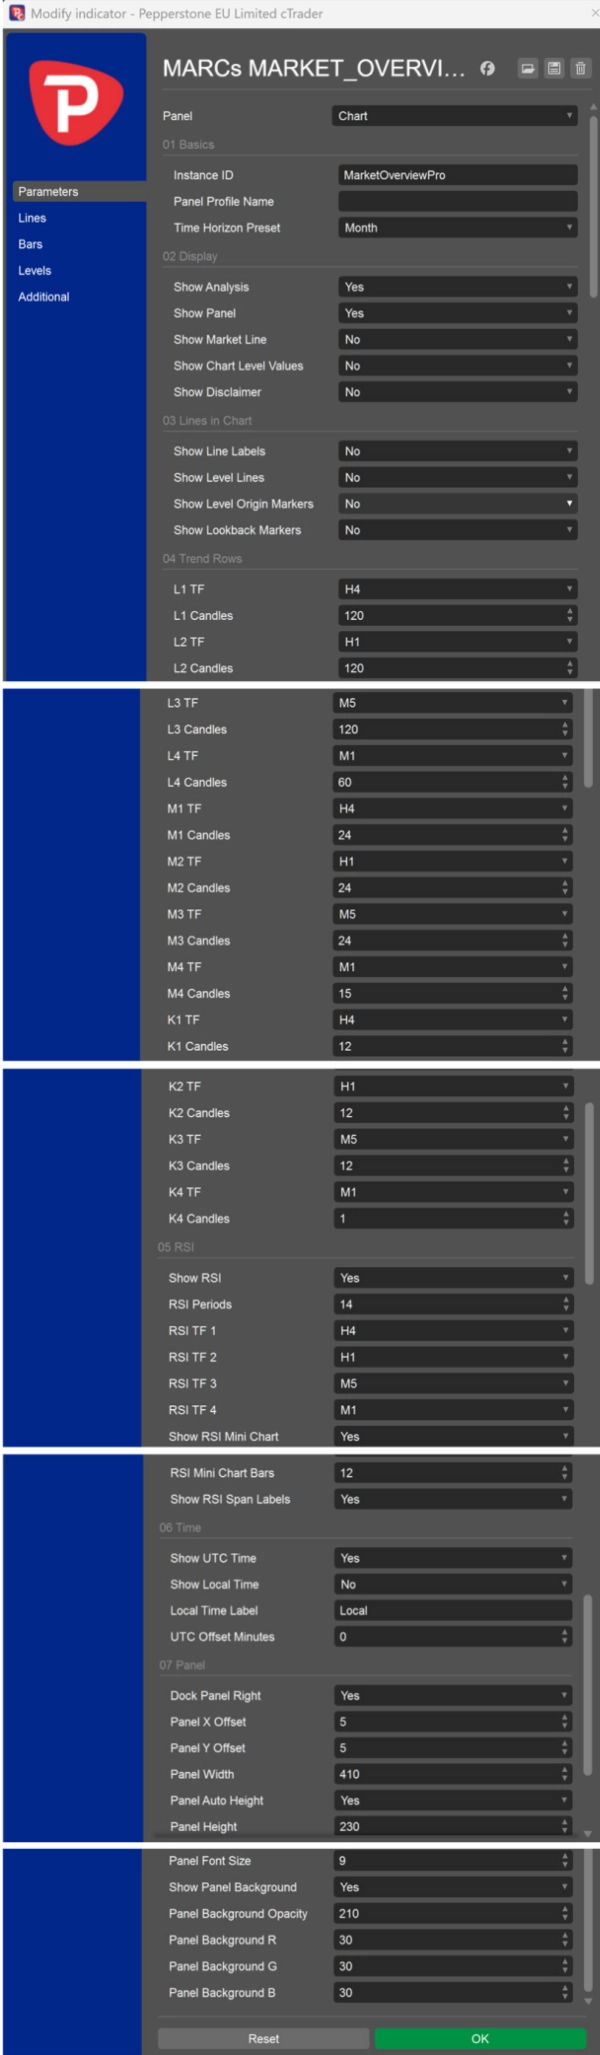
Nó hiển thị một bảng điều khiển nhỏ gọn trên biểu đồ với bối cảnh xu hướng, các chỉ số RSI, thông tin thị trường/phiên và các cài đặt trước phạm vi thời gian có thể cấu hình. Chỉ báo ban đầu được phát triển xoay quanh phân tích XAUUSD / Vàng, nhưng được thiết kế để hoạt động như một công cụ tổng quan thị trường chung trên bất kỳ ký hiệu biểu đồ nào có sẵn, tùy thuộc vào chất lượng dữ liệu của nhà môi giới và lịch sử thị trường có sẵn.
Các tính năng chính:
- Các hàng xu hướng đa khung thời gian cho bối cảnh thị trường ngắn, trung và dài hạn
- Các cài đặt trước có thể cấu hình Ngày, Tuần, Tháng, Năm, Phạm vi ngắn, Phạm vi dài và Tùy chỉnh
- Giá trị RSI và biểu đồ RSI nhỏ trên các khung thời gian đã chọn
- Hiển thị tùy chọn giờ UTC và giờ địa phương
- Đường thị trường/phiên tùy chọn
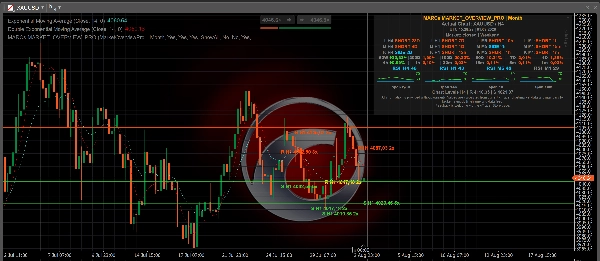
- Đường tham chiếu cấp biểu đồ tùy chọn
- Giá trị cấp biểu đồ tùy chọn hiển thị trực tiếp trong bảng điều khiển
Đường mức và Giá trị cấp biểu đồ:
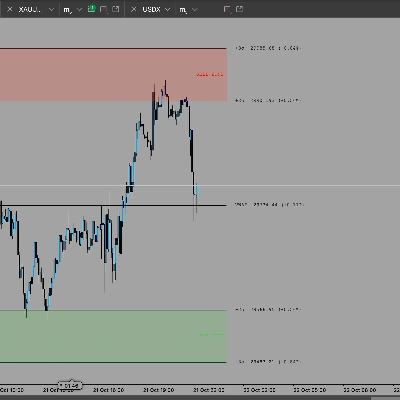
Cài đặt Hiển thị Đường Mức tùy chọn có thể hiển thị các mức tham chiếu biểu đồ được tính toán từ một khung thời gian đã chọn: M1, M5, M15, M30, H1, H4, D1, W1 hoặc MN1. Đối với các lựa chọn khung thời gian riêng lẻ này, chỉ báo hiển thị mức kháng cự được tính toán gần nhất phía trên giá hiện tại và mức hỗ trợ được tính toán gần nhất phía dưới giá hiện tại. Hiển thị Tất cả hiển thị bộ mức H1 rộng hơn từ phép tính mức H1 hiện có. Không giữ các đường mức ẩn.
Cài đặt Hiển thị Giá trị Cấp Biểu đồ tùy chọn có thể hiển thị các giá trị tham chiếu kháng cự/hỗ trợ gần nhất tương tự trực tiếp trong bảng điều khiển mà không vẽ đường trên biểu đồ. Đường trong bảng được gắn nhãn, ví dụ, "Chart Levels H1 | R ... | S ..." để làm rõ rằng các giá trị đề cập đến các tham chiếu cấp biểu đồ.
Cách tính các Đường Mức:
Các mức được lấy từ các đỉnh và đáy dao động trong quá khứ ở khung thời gian đã chọn. Các điểm dao động gần nhau được nhóm thành các cụm mức, và chỉ những khu vực có đủ số lần chạm lặp lại mới được hiển thị. Điều này làm cho các đường trở thành các dấu hiệu bối cảnh thị trường trực quan dựa trên lịch sử biểu đồ có sẵn.
Quan trọng:
MARCs Market Overview Pro là công cụ tổng quan thị trường chỉ dành cho phân tích. Nó không thực hiện giao dịch, quản lý vị thế, cung cấp lời khuyên đầu tư hoặc đảm bảo kết quả giao dịch.
Đường Mức không phải là tín hiệu mua, tín hiệu bán, khuyến nghị dừng lỗ, khuyến nghị chốt lời hay lời khuyên đầu tư. Chúng không dự đoán rằng giá sẽ đảo chiều, bứt phá hoặc phản ứng tại một mức cụ thể.
Tất cả các chỉ số phụ thuộc vào dữ liệu biểu đồ cTrader có sẵn, nguồn cấp ký hiệu của nhà môi giới, khung thời gian và lịch sử thị trường. Giá trị có thể khác nhau giữa các nhà môi giới, ký hiệu và nguồn dữ liệu.
Giao dịch có rủi ro. Hiệu suất trong quá khứ không đảm bảo kết quả trong tương lai.
GHI CHÚ MINH BẠCH
Chỉ báo này được phát triển với sự hỗ trợ của các công cụ dựa trên AI.
Tóm tắt
The indicator supports optional display of UTC and local times, market/session lines, and chart-level reference lines. These reference lines represent calculated support and resistance levels derived from clusters of past swing highs and lows on selected timeframes ranging from 1 minute to monthly intervals. Users can choose to show these levels as lines on the chart or as numeric values within the dashboard panel.
Originally developed with a focus on XAUUSD (Gold), MARCs MARKET_OVERVIEW_Pro is adaptable to any chart symbol supported by the broker’s data feed and market history. It serves as an analysis tool providing visual market structure and momentum insights but does not execute trades or offer trading advice. The indicator’s readings depend on the quality and availability of broker data and chart history.
Thảo luận
Đánh giá của khách hàng
Câu hỏi thường gặp
Sản phẩm khác của tác giả này


















Giá