

Tradingfcs_vwap
Chỉ báo
Phiên bản 1.0, Oct 2026
Windows, Mac

Kể từ 05/07/2026
35.54M
Khối lượng đã giao dịch
278.58K
Pip đạt được
Mô tả
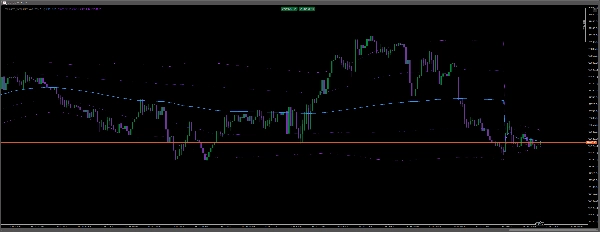
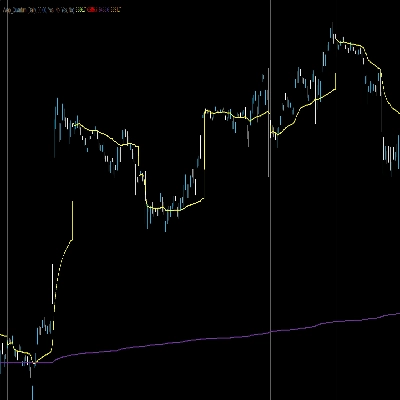
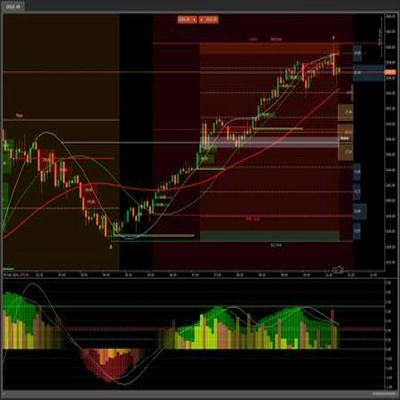
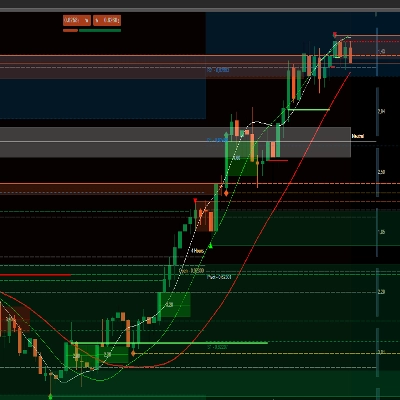
- 🔵 Blue VWAP Line: Represents the volume-weighted average trading price, helping identify intraday market direction and dynamic support or resistance.
- 🟣 Purple Deviation Bands: Highlight areas where price has moved away from its average, helping traders identify potential overextension and reversal opportunities.
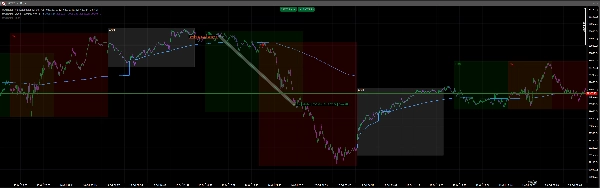
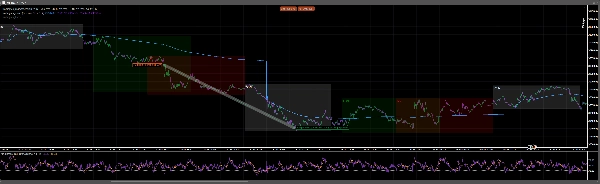
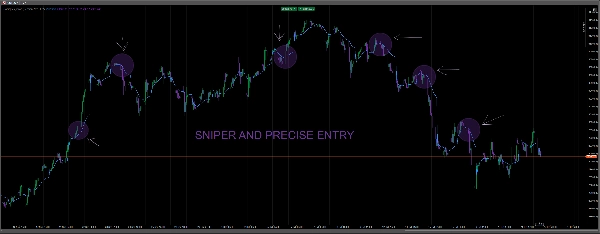
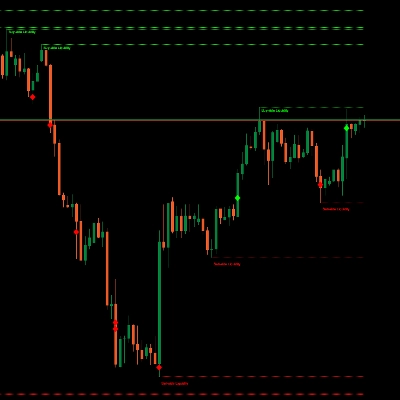
- 📈 Price Rejections: Highlighted H1 chart illustrates how price reactions around VWAP can precede bullish or bearish moves.
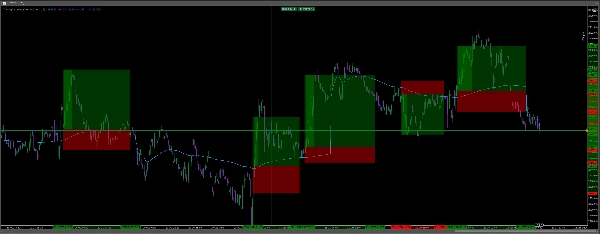
⏰ Trading Sessions: Your separate session overlays identify Asian, London, and New York trading periods, helping you evaluate opportunities during different market conditions.
----------------------------------
How It Helps Traders Spot Opportunities
🟢 BUY Opportunities: When price holds above VWAP and successfully retests it as support, traders can look for bullish continuation.
🔴 SELL Opportunities: When price trades below VWAP and rejects it as resistance, traders can identify potential bearish continuation.
⚡ Precision Scalping: On the M1 and M5 timeframes, VWAP helps traders identify potential entries, pullbacks, and exits using price action and momentum confirmation
Tóm tắt
Tóm tắt AI
Tradingfcs_vwap is a technical indicator designed to assist traders in identifying intraday market trends and potential trade entries using the Volume Weighted Average Price (VWAP). It features a blue VWAP line that reflects the average trading price weighted by volume, serving as a dynamic support or resistance level. Purple deviation bands highlight price movements away from the VWAP, indicating possible overextensions and reversal points.
The indicator also visualizes price rejections on the hourly chart, showing how price interactions with the VWAP can signal bullish or bearish moves. Separate overlays mark the Asian, London, and New York trading sessions, enabling traders to assess market behavior across different periods.
Key trading signals include:
- Buy opportunities when price holds above VWAP and retests it as support.
- Sell opportunities when price trades below VWAP and rejects it as resistance.
- Precision scalping on 1- and 5-minute timeframes by identifying entries, pullbacks, and exits through price action and momentum confirmation.
This tool supports analysis based on volume, support and resistance, and trend strength, using bar data inputs and providing signal outputs for enhanced decision-making in various trading styles.
Hồ sơ chỉ báo
Danh mục chỉ báo
Hỗ trợ & kháng cự
Loại đầu ra
Tín hiệu
Yêu cầu dữ liệu
Chỉ dữ liệu nến
Tín hiệu được hỗ trợ
Sức mạnh xu hướng
Thảo luận
Đánh giá của khách hàng
0.0
Đánh giá: 0
Đánh giá của khách hàng
Sản phẩm này chưa có đánh giá nào. Bạn đã dùng thử chưa? Hãy là người đầu tiên chia sẻ với mọi người!
Câu hỏi thường gặp
VWAP
Support & Resistance
Các sản phẩm có sẵn trên cTrader Store, bao gồm bot giao dịch, chỉ báo và plugin, được cung cấp bởi các nhà phát triển bên thứ ba và chỉ nhằm mục đích cung cấp thông tin và tiếp cận kỹ thuật. cTrader Store không phải là nhà môi giới và không cung cấp lời khuyên đầu tư, khuyến nghị cá nhân hay bất kỳ đảm bảo nào về hiệu suất trong tương lai.







Giá
Kể từ 05/07/2026
35.54M
Khối lượng đã giao dịch
278.58K
Pip đạt được