
Fair Value Gap Pro+
Chỉ báo
Phiên bản 1.0, Nov 2025
Windows, Mac
3.0
Đánh giá: 2

Mô tả
Fair Value Gap Pro – Phát Hiện FVG Cấp Độ Tổ Chức
📝 Mô Tả Sản Phẩm
Mở Khóa Độ Chính Xác Tổ Chức với Fair Value Gap Pro
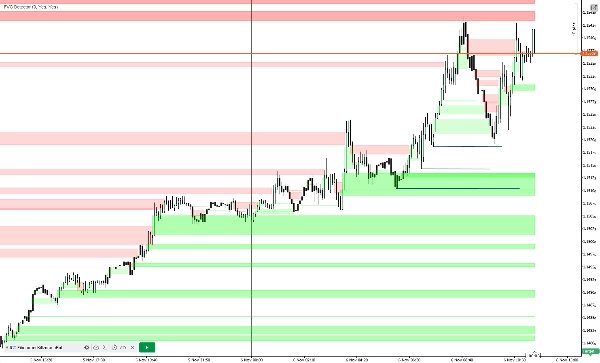
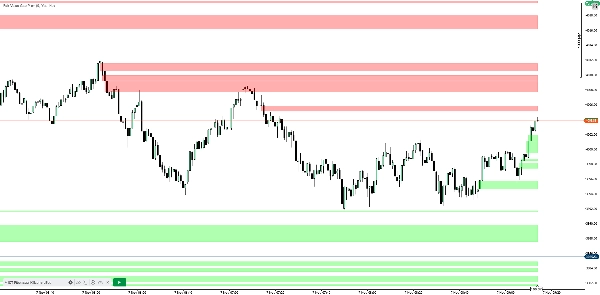
Fair Value Gap Pro là một chỉ báo phủ mạnh mẽ được thiết kế cho các nhà giao dịch muốn xác định và khai thác các bất hợp lý về giá của tổ chức với độ chính xác như phẫu thuật. Được xây dựng cho các nhà giao dịch lướt sóng, giao dịch swing và chiến lược thuật toán, công cụ này tự động phát hiện các Fair Value Gap (FVG) tăng và giảm sử dụng logic 3 cây nến—không rườm rà, chỉ các vùng có thể hành động.
🔍 Tính Năng Chính:
- Tự động phát hiện FVG Tăng & Giảm sử dụng logic cây nến 1 và cây nến 3
- Bộ lọc kích thước khoảng trống tùy chỉnh (tính bằng pip) để loại bỏ nhiễu
- Logic kéo dài cho đến khi được lấp đầy để theo dõi vùng liên tục
- Làm mờ hoặc loại bỏ các khoảng trống đã lấp đầy để biểu đồ sạch sẽ
- Hiển thị phủ với các hình chữ nhật bán trong suốt
- Tùy chỉnh màu sắc cho các vùng tăng và giảm
🧠 Lợi Thế Chiến Lược:
- Phát hiện các vùng đảo chiều có xác suất cao trước đám đông
- Phù hợp với các mô hình tổ chức như ICT và Thuyết Nhà Tạo Thị
- Sử dụng kết hợp với các khối lệnh, vùng thanh khoản trống, và vùng mất cân bằng
📊 Các Trường Hợp Sử Dụng
- Lướt Sóng: Xác định các mất cân bằng nhỏ để vào lệnh chính xác
- Giao Dịch Swing: Theo dõi các khoảng trống chưa được lấp đầy qua các phiên
- Phát Triển Thuật Toán: Tích hợp với bot để tự động hóa logic vùng
- Kiểm Tra Lại: Xác nhận hành vi FVG qua dữ liệu lịch sử
⚙️ Tham Số
- Màu Khoảng Trống Tăng: Xác định màu sắc dùng để làm nổi bật các Fair Value Gap tăng trên biểu đồ.
- Màu Khoảng Trống Giảm: Xác định màu sắc dùng để làm nổi bật các Fair Value Gap giảm.
- Khoảng Trống Tối Thiểu (pips): Lọc bỏ các khoảng trống nhỏ hơn ngưỡng pip đã chỉ định để giảm nhiễu.
- Kéo Dài Cho Đến Khi Lấp Đầy: Giữ vùng khoảng trống kéo dài về phía trước cho đến khi giá lấp đầy.
- Hiển Thị Khoảng Trống Đã Lấp Đầy: Cho phép bạn làm mờ hoặc hoàn toàn loại bỏ vùng khi chúng đã được lấp đầy.
🎯 Đối Tượng Mục Tiêu
- Các nhà giao dịch sử dụng ICT, SMC hoặc các mô hình tổ chức
- Các nhà phát triển xây dựng bot dựa trên sự hội tụ
- Các nhà phân tích tìm kiếm sự rõ ràng trực quan về các bất hợp lý giá
📦 Ý Tưởng Thêm Cho Danh Sách Cửa Hàng
- Thêm ảnh chụp màn hình cho thấy các khoảng trống tăng và giảm đang hoạt động
- Bao gồm video demo ngắn với hướng dẫn biểu đồ trực tiếp
- Cung cấp bản dùng thử miễn phí hoặc phiên bản giới hạn để tăng chuyển đổi
Tóm tắt
Tóm tắt AI
Fair Value Gap Pro+ is an overlay indicator designed to identify and visualize institutional price inefficiencies known as Fair Value Gaps (FVGs) on trading charts. It automatically detects bullish and bearish FVGs using a three-candle logic, highlighting these zones with customizable semi-transparent rectangles. The indicator includes features such as adjustable minimum gap size filters to reduce noise, extend-until-filled logic to track persistent zones, and options to fade or remove filled gaps for clearer chart analysis. Users can customize colors for bullish and bearish gaps to suit their preferences.
This tool supports various trading styles including scalping, swing trading, algorithmic strategy development, and backtesting. It aligns with institutional trading models like ICT and Market Maker Theory and can be used in conjunction with order blocks, liquidity voids, and imbalance zones to identify high-probability reversal areas. Fair Value Gap Pro+ is applicable across multiple markets including Forex, indices, commodities, cryptocurrencies, and stocks. It is suitable for traders, analysts, and developers seeking precise detection of market imbalances and enhanced visual clarity on price inefficiencies.
This tool supports various trading styles including scalping, swing trading, algorithmic strategy development, and backtesting. It aligns with institutional trading models like ICT and Market Maker Theory and can be used in conjunction with order blocks, liquidity voids, and imbalance zones to identify high-probability reversal areas. Fair Value Gap Pro+ is applicable across multiple markets including Forex, indices, commodities, cryptocurrencies, and stocks. It is suitable for traders, analysts, and developers seeking precise detection of market imbalances and enhanced visual clarity on price inefficiencies.
Hồ sơ chỉ báo
Đánh giá của khách hàng
3.0
Đánh giá: 2
5 | 50 % | |
4 | 0 % | |
3 | 0 % | |
2 | 0 % | |
1 | 50 % |
Đánh giá của khách hàng
November 9, 2025
Absolutely no multi-timeframe support despite this line in the description: ✅ Multi-Timeframe Support Display higher timeframe FVGs (e.g., H1, H4, D1) directly on lower charts like M5 or M15 for confluence.
November 9, 2025
Fair Value Gap Pro+ is a top-tier ICT tool - precise FVG detection, clean visuals, and real-time updates. Perfect for mapping imbalance zones and timing entries. A dream for Smart Money traders; adding alerts would make it flawless.
Thảo luận
Câu hỏi thường gặp
Signal
Indices
Commodities
GBPUSD
RSI
Bollinger
Fibonacci
Scalping
AI
XAUUSD
NAS100
MACD
BTCUSD
Forex
Breakout
EURUSD
Martingale
Prop
ZigZag
Supertrend
Fair Value Gap
SMC
Crypto
Grid
Stocks
ATR
USDJPY
VWAP
Các sản phẩm có sẵn trên cTrader Store, bao gồm bot giao dịch, chỉ báo và plugin, được cung cấp bởi các nhà phát triển bên thứ ba và chỉ nhằm mục đích cung cấp thông tin và tiếp cận kỹ thuật. cTrader Store không phải là nhà môi giới và không cung cấp lời khuyên đầu tư, khuyến nghị cá nhân hay bất kỳ đảm bảo nào về hiệu suất trong tương lai.


![Logo "Gaussian Channel [Iridio Capital]"](https://cdn.ctrader.com/image/webp/7c039209-5573-4a54-a072-f9528b503103_41960)


Giá
Kể từ 22/11/2024
135
Lượt bán
2.6K
Cài đặt miễn phí