

Descrição
Quem está envolvido em negociações sabe o quão importante é levar em conta a sessão anterior.
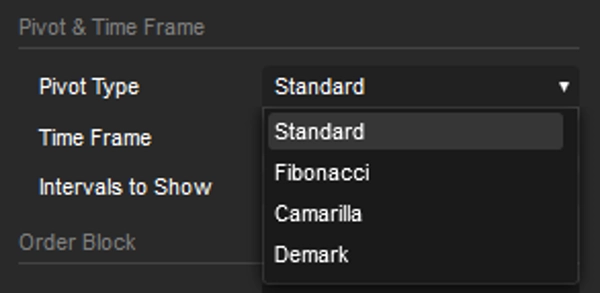
Preparei este indicador Pivot, com intervalos de 15 minutos até um mês, e ele inclui blocos de ordens e linhas de tendência. Ambas as opções são baseadas nos pontos mais altos e mais baixos da sessão anterior.
A configuração padrão está definida para um período de 5 minutos.
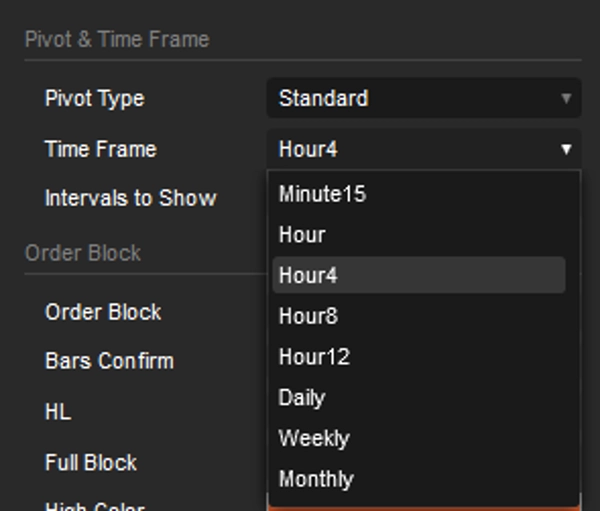
O pivot está definido para 4 horas, e o intervalo é 5, o que significa que ele olha para trás 20 horas em intervalos de 4 horas. Isso é perfeito para quem negocia diariamente.
No entanto, se você é fã de Swing Trading, só precisa mudar o intervalo do Pivot; todo o resto se ajusta automaticamente.
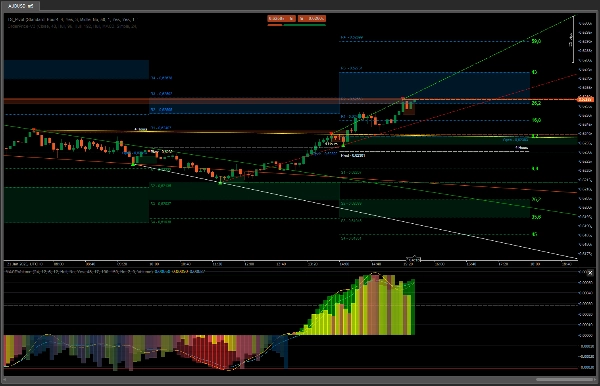
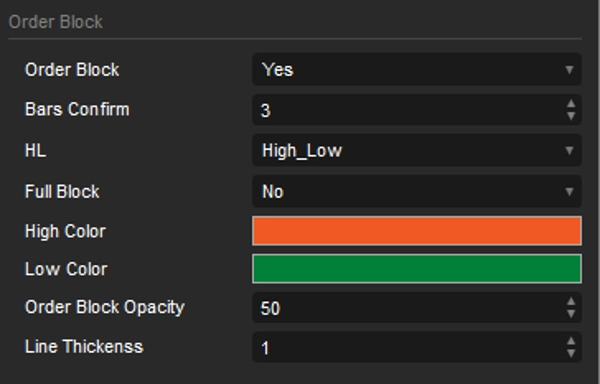
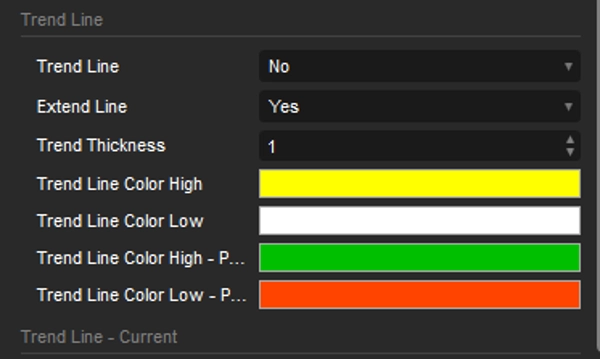
Os blocos de ordens destacam áreas potenciais onde o preço pode encontrar suporte ou resistência, oferecendo insights sobre possíveis reversões ou continuações. Ao combiná-los com as linhas de tendência geradas automaticamente para o período escolhido, os traders podem identificar com mais precisão a direção potencial do preço e possíveis pontos de entrada ou saída. A capacidade de visualizar essas linhas de tendência em múltiplos períodos fornece uma compreensão mais completa da estrutura do mercado.
Com ferramentas adicionais como
OrderPrice V3 https://ctrader.com/products/397
NTMPICLL https://ctrader.com/products/327
Range Box Level https://ctrader.com/products/245
Or RangeBoxFibonacci https://ctrader.com/products/526
Market Session https://ctrader.com/products/94
MacdVolume https://ctrader.com/products/267
4MA https://ctrader.com/products/247
Você será invencível
Boa sorte 😀
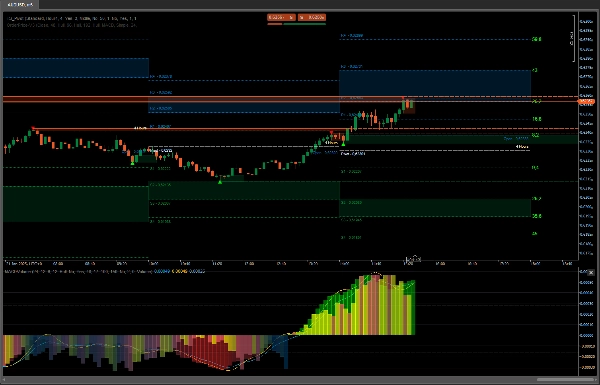
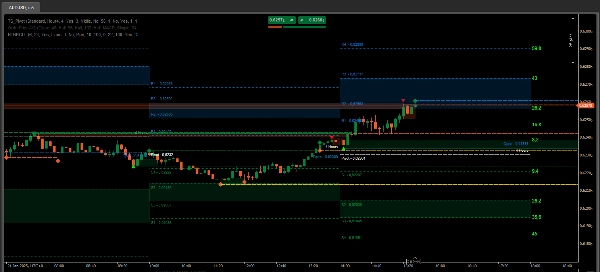
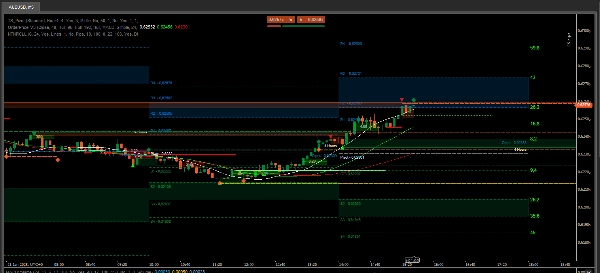
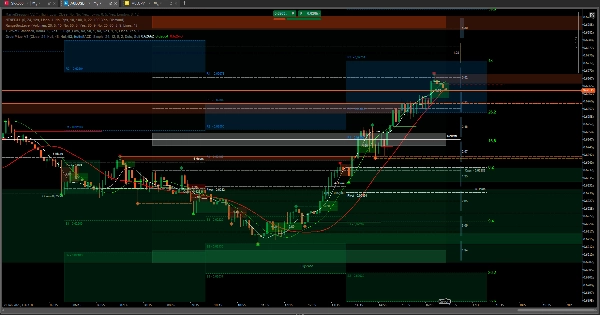
No caso de uma compra, observando as duas últimas imagens o comportamento do OrderPrice e das médias móveis incorporadas, quando aparece uma linha verde e a média móvel está abaixo, é o momento perfeito para abrir uma transação de compra.
Com os dados da sessão anterior, você pode determinar até onde o preço pode ir ou onde pode ocorrer resistência. Se romper, pode continuar até o segundo ponto, que pode ser a zona neutra do RangeBoxLevel. Se ultrapassar isso e não houver sinais de que as médias móveis querem mudar de direção, o preço pode alcançar a zona do bloco de ordens da sessão anterior.
Na última imagem, há uma captura de tela de uma situação perfeita para entrar e sair de uma transação. O resto é apenas observar e tirar conclusões.
Essas ferramentas são essenciais quando se trata de vencer através da negociação de ativos.
Resumo
Key features include the integration of order blocks and trend lines derived from previous session data. Order blocks identify potential support and resistance zones, aiding in spotting possible price reversals or continuations. The indicator automatically generates trend lines for the selected timeframe, helping traders assess market structure and potential price direction. Visualizing these trend lines across multiple timeframes enhances market analysis.
TS_Pivot can be used alongside complementary tools such as OrderPrice V3, NTMPICLL, Range Box Level, RangeBoxFibonacci, Market Session, MacdVolume, and 4MA to refine entry and exit decisions. By combining moving averages and order block signals, traders can identify optimal moments to open buy or sell positions. The indicator supports various markets including Forex, cryptocurrencies, commodities, indices, and stocks.
Avaliações de clientes
5 | 100 % | |
4 | 0 % | |
3 | 0 % | |
2 | 0 % | |
1 | 0 % |


