
Opis
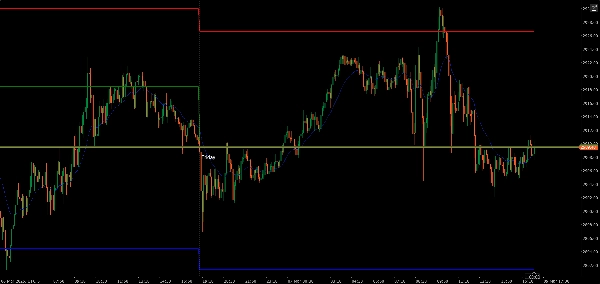
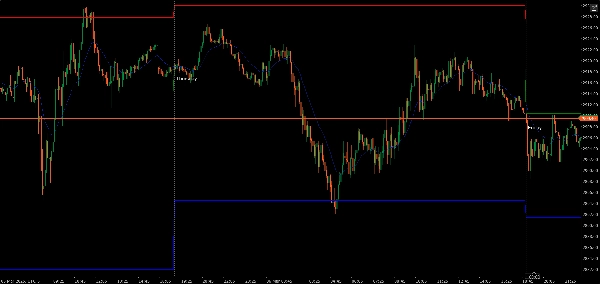
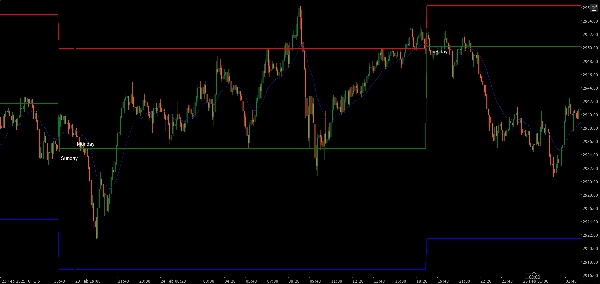
wskaźnik poprzedniego dnia: maksimum, minimum i zamknięcie.
niebieska linia pokazuje minimum poprzedniego dnia.
czerwona linia pokazuje maksimum poprzedniego dnia.
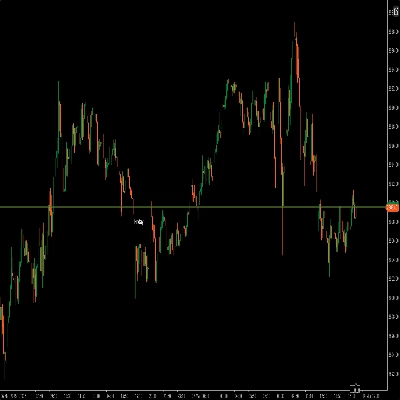
zielona linia pokazuje zamknięcie poprzedniego dnia.
Podsumowanie
Podsumowanie AI
The trPDHLC indicator displays the previous day's high, low, and closing prices on a trading chart. It uses color-coded lines for clear visualization: a red line marks the previous day's high, a blue line indicates the previous day's low, and a green line shows the previous day's closing price. This tool helps traders quickly reference key price levels from the prior trading day, aiding in technical analysis and decision-making. The indicator is tagged for use with indices markets.
Profil wskaźnika
Opinie klientów
0.0
Opinie: 0
Opinie klientów
Ten produkt nie ma jeszcze opinii. Wypróbowałeś(-aś) go już? Bądź pierwszy(-a) i powiedz o tym innym!
Dyskusja
Częste pytania
Indices
Produkty dostępne za pośrednictwem cTrader Store, w tym boty handlowe, wskaźniki i wtyczki, dostarczane są przez deweloperów zewnętrznych i udostępniane wyłącznie w celach informacyjnych oraz w celu zapewnienia dostępu technicznego. cTrader Store nie jest brokerem i nie zapewnia doradztwa inwestycyjnego, nie udziela spersonalizowanych rekomendacji ani nie gwarantuje przyszłych wyników.
Więcej od tego autora


Cena
Od 08/03/2025
1
Sprzedaż