
Opis
https://chartshots.spotware.com/c/695be69b1a3ca
https://chartshots.spotware.com/c/695be2a98e848
https://chartshots.spotware.com/c/695be7e8e88fa
https://chartshots.spotware.com/c/695be31346fe7
https://chartshots.spotware.com/c/695be3bd18aea
https://chartshots.spotware.com/c/695be5d5687c7
Auto Chart Patterns
📊 CO TO JEST?
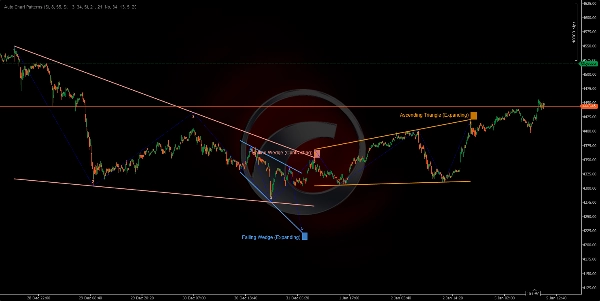
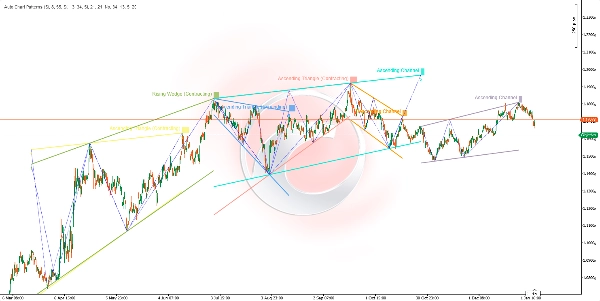
Wskaźnik Auto Chart Patterns jest zaawansowanym skanerem formacji geometrycznych, który automatycznie wykrywa i wizualizuje klasyczne formacje wykresów, wykorzystując analizę punktów zwrotnych na wielu ramach czasowych. Identyfikuje 14 różnych formacji geometrycznych w tym kanały, kliny i trójkąty, łącząc lokalne maksima i minima za pomocą linii trendu, tworząc kompleksowy system rozpoznawania wzorców.
🎯 DO CZEGO TO SŁUŻY?
Ten wskaźnik pomaga traderom w:
- Automatycznym wykrywaniu 14 klasycznych formacji wykresów (kanały, kliny, trójkąty) 📐
- Identyfikowaniu potencjalnych stref wybicia z wyprzedzeniem ⚡
- Wizualizacji struktury rynku poprzez geometryczne relacje cenowe 🔍
- Handlu formacjami kontynuacji i odwrócenia z wizualnym potwierdzeniem ✅
- Filtrowaniu formacji według kierunku trendu i typu końcowego punktu zwrotnego 🎛️
- Analizie wielu ram czasowych punktów zwrotnych jednocześnie dla potwierdzenia 🌊
🔍 JAK TO DZIAŁA?
System wykrywania punktów zwrotnych 📍
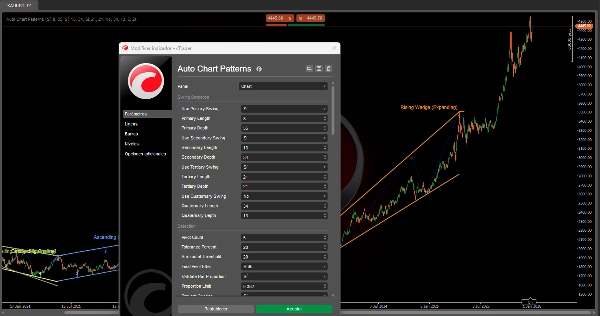
Wskaźnik używa do czterech niezależnych detektorów punktów zwrotnych działających jednocześnie, każdy z konfigurowalną czułością:
- Logika wykrywania:
-
- Monitoruje maksima i minima cenowe w obrębie przesuwającego się okna (Okres).
- Identyfikuje lokalne szczyty (punkty zwrotne górne) i dołki (punkty zwrotne dolne).
- Potwierdza punkty zwrotne dopiero po spełnieniu minimalnej głębokości (zapobiega szumowi).
- Punkt zwrotny górny: Cena osiąga najwyższy szczyt w Okresie, następnie spada przez
MinDepthsłupków. - Punkt zwrotny dolny: Cena osiąga najniższy dołek w Okresie, następnie rośnie przez
MinDepthsłupków.
- Cztery warstwy punktów zwrotnych:
-
- Pierwotny punkt zwrotny (Domyślnie: Długość 8, Głębokość 55) - Struktura długoterminowa 🔵
- Wtórny punkt zwrotny (Domyślnie: Długość 13, Głębokość 34) - Struktura średnioterminowa 🟢
- Trzeciorzędny punkt zwrotny (Domyślnie: Długość 21, Głębokość 21) - Struktura krótkoterminowa 🟡
- Czwartorzędny punkt zwrotny (Domyślnie: Wyłączony) - Niestandardowa ramka czasowa 🟣
Każdy detektor może być włączany/wyłączany niezależnie, aby skupić się na określonych strukturach rynku.
Proces formowania wzorców 🎨
KROK 1 - ZBIERANIE PUNKTÓW ZWROTNYCH:
- System zbiera 5 lub 6 najnowszych punktów zwrotnych z dowolnego aktywnego detektora.
- Punkty muszą się na przemian zmieniać między szczytami a dołkami (struktura zygzakowa).
- Przykład 5-punktowy: Szczyt → Dołek → Szczyt → Dołek → Szczyt.
KROK 2 - KONSTRUKCJA LINI TRENDU:
- Oddziela punkty zwrotne na górne (szczyty) i dolne (dołki).
- Rysuje dwie linie trendu: górną i dolną granicę.
- Dla granic 3-punktowych: testuje 3 kombinacje (0-2, 0-1, 1-2) i wybiera najlepsze dopasowanie ⭐
- Sprawdza, czy linie trendu nie przecinają korpusów świec (dozwolone tylko knoty).
- Oblicza wskaźnik dopasowania: linie muszą dotykać mniej niż 20% słupków między punktami zwrotnymi.
KROK 3 - ANALIZA GEOMETRYCZNA:
- Mierzy kąt między górną a dolną granicą.
- Określa, czy formacja jest Rozszerzająca się (poszerzająca się), Zacieśniająca się (zwężająca się) lub Równoległa (stała szerokość).
- Identyfikuje kierunek trendu: Wzrostowy, Spadkowy lub Neutralny (poziomy).
- Klasyfikuje do jednego z 14 typów formacji na podstawie geometrii.
KROK 4 - WALIDACJA I FILTROWANIE:
- Sprawdzenie proporcji słupków: Zapewnia proporcjonalne rozmieszczenie punktów zwrotnych (zapobiega zniekształconym wzorcom) ✅
- Zapobieganie nakładaniu się: Blokuje nowe formacje kolidujące z istniejącymi 🚫
- Sprawdzenie duplikatów: Zapobiega ponownemu rysowaniu tej samej formacji.
- Filtr końcowego punktu zwrotnego: Wyświetla tylko formacje kończące się określonym kierunkiem punktu zwrotnego (Wzrost/Spadek/Oba).
- Filtr typu formacji: Włącza/wyłącza określone kategorie formacji.
KROK 5 - WIZUALIZACJA:
- Rysuje górne i dolne linie graniczne w żywych kolorach z palety 12 kolorów 🎨
- Opcjonalnie wyświetla linie zygzakowe łączące punkty zwrotne (kropkowane niebieskie).
- Pokazuje numery punktów zwrotnych (1, 2, 3, 4, 5) przy każdym punkcie zwrotnym.
- Oznacza formację nazwą wzoru przy końcowym punkcie zwrotnym.
- Koloruje tło za etykietą dla lepszej czytelności.
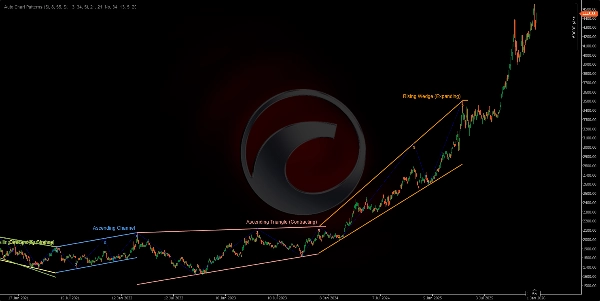
📐 14 WYKRYTYCH FORMACJI
KANAŁY (Formacje równoległe) 📦
- Kanał wznoszący się (Równoległy wzrostowy) 📈
-
- Obie granice nachylone są w górę pod podobnym kątem.
- Wskazuje na trend kontynuacji wzrostowej.
- Handel: Kupuj przy dolnej granicy, sprzedawaj przy górnej.
- Kanał opadający (Równoległy spadkowy) 📉
-
- Obie granice nachylone są w dół pod podobnym kątem.
- Wskazuje na trend kontynuacji spadkowej.
- Handel: Sprzedawaj przy górnej granicy, kupuj przy dolnej.
- Kanał boczny (Boczny/Poziomy) ↔️
-
- Obie granice są prawie poziome.
- Wskazuje na konsolidację lub niezdecydowanie.
- Handel: Strategia zakresowa, kupuj na wsparciu/sprzedawaj na oporze.
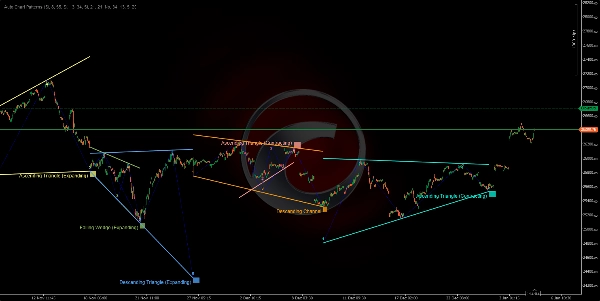
ROZSZERZAJĄCE SIĘ KLINY (Formacje poszerzające się) 📣
4. Klin wznoszący się (poszerzający się) ⚠️
* Obie granice nachylone w górę, z rozszerzającą się przerwą.
* Formacja odwrócenia spadkowego - cena traci impet wzrostowy.
* Handel: Czekaj na przebicie dolnej granicy, zajmij pozycję krótką.
5. Klin opadający (poszerzający się) ⚠️
* Obie granice nachylone w dół, z rozszerzającą się przerwą.
* Formacja odwrócenia wzrostowego - cena traci impet spadkowy.
* Handel: Czekaj na przebicie górnej granicy, zajmij pozycję długą.
6. Trójkąt rozbieżny (Trójkąt poszerzający się) 🔺
* Górna granica nachylona w górę, dolna w dół.
* Formacja o wysokiej zmienności i rozszerzaniu się zakresu.
* Handel: Bardzo ryzykowna, czekaj na wyraźne wybicie kierunkowe.
7. Trójkąt wznoszący się (poszerzający się) 📊
* Górna granica pozioma, dolna nachylona w górę.
* Kontynuacja wzrostowa z rozszerzającym się zakresem.
* Handel: Kupuj przy wybiciu górnej granicy.
8. Trójkąt opadający (poszerzający się) 📊
* Dolna granica pozioma, górna nachylona w dół.
* Kontynuacja spadkowa z rozszerzającym się zakresem.
* Handel: Sprzedawaj przy wybiciu dolnej granicy.
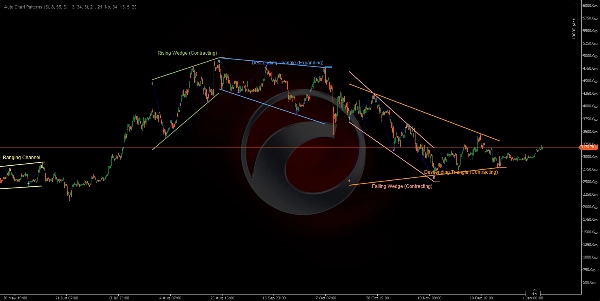
ZACIEŚNIAJĄCE SIĘ KLINY (Formacje zbieżne) 🔻
9. Klin wznoszący się (zacieśniający się) 🔺
* Obie granice nachylone w górę, z zacieśniającą się przerwą.
* Formacja odwrócenia spadkowego - wyczerpanie wzrostów ⚠️
* Handel: Krótka pozycja przy przebiciu dolnej granicy.
10. Klin opadający (zacieśniający się) 🔻
* Obie granice nachylone w dół, z zacieśniającą się przerwą.
* Formacja odwrócenia wzrostowego - wyczerpanie spadków ⚠️
* Handel: Długa pozycja przy przebiciu górnej granicy.
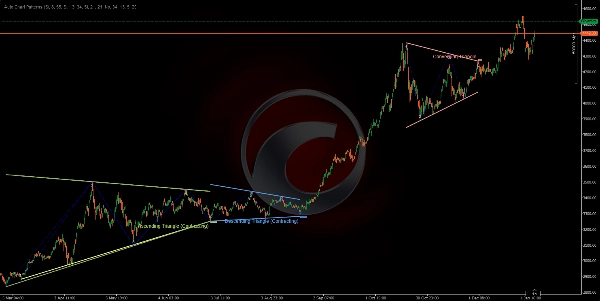
ZACIEŚNIAJĄCE SIĘ TRÓJKĄTY (Formacje konsolidacyjne) △
11. Trójkąt zbieżny (Trójkąt symetryczny) ⚖️
* Górna granica nachylona w dół, dolna w górę pod podobnym kątem.
* Konsolidacja neutralna - formacja kontynuacji.
* Handel: Czekaj na wybicie w określonym kierunku, handluj zgodnie z nim.
12. Trójkąt opadający (zacieśniający się) 📐
* Dolna granica pozioma (wsparcie), górna nachylona w dół.
* Formacja kontynuacji spadkowej 🔴
* Handel: Krótka pozycja przy przebiciu wsparcia z wolumenem.
13. Trójkąt wznoszący się (zacieśniający się) 📐
* Górna granica pozioma (opór), dolna nachylona w górę.
* Formacja kontynuacji wzrostowej 🟢
* Handel: Długa pozycja przy przebiciu oporu z wolumenem.
14. Nieprawidłowe/Nieznane ❌
* Formacje, które nie spełniają kryteriów geometrycznych.
* Automatycznie filtrowane.
Podsumowanie
Key functionalities include identifying potential breakout zones, visualizing market structure through geometric price relationships, and supporting trading of continuation and reversal patterns with visual confirmation. Users can filter detected patterns by trend direction, pivot type, and formation category. The indicator prevents overlapping and duplicate patterns to maintain clarity.
The 14 detected formations cover a range of classical patterns such as ascending, descending, and ranging channels; expanding and contracting wedges; and various triangle types (converging, diverging, ascending, descending). Visual outputs include color-coded boundary lines, pivot numbering, zigzag swing lines, and labeled pattern names for easy interpretation. This tool supports analysis across multiple markets including Forex, stocks, commodities, indices, and cryptocurrencies.
Opinie klientów
5 | 50 % | |
4 | 50 % | |
3 | 0 % | |
2 | 0 % | |
1 | 0 % |


