
Beschreibung
Übernehmen Sie die Kontrolle über Ihren CCI-Handel!
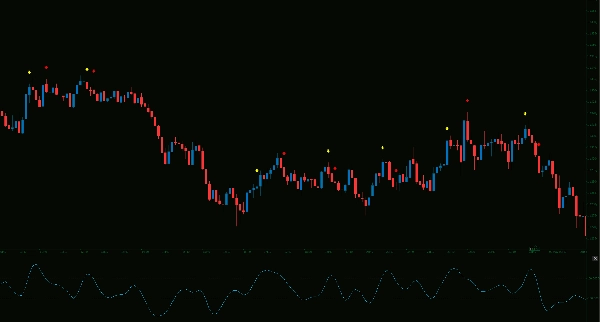
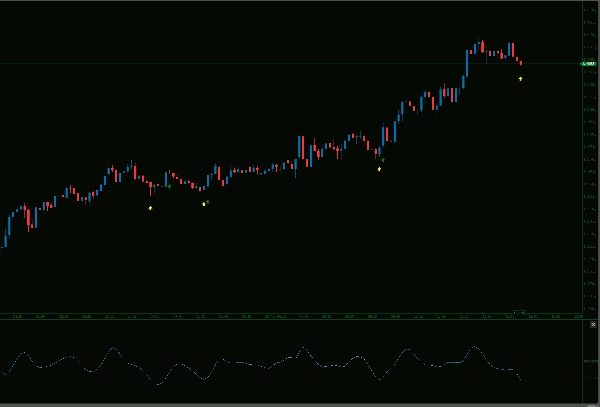
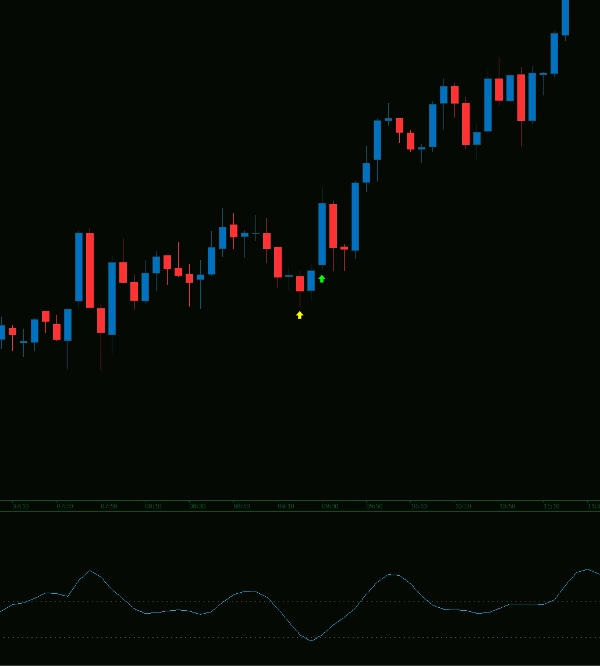
Dieser fortschrittliche geglättete CCI-Indikator bietet vollständig anpassbare Alarme und visuelle Signale. Erkennen Sie CCI-Ausbrüche genau mit deutlichen Auf-/Ab-Pfeilen (bullisch/bärisch, Einstieg/Ausstieg) und wählen Sie Ihren bevorzugten Audioalarm aus einer integrierten Liste. Filtern Sie Signale, um sich nur auf bullische oder bärische Setups zu konzentrieren. Ihr CCI, Ihre Regeln!
Wichtiger Hinweis zur Maximierung des Erfolgs:
Obwohl leistungsstark, ist es entscheidend, diesen Indikator als Werkzeug für Konfluenz zu verwenden und nicht als alleinige Entscheidungsgrundlage für den Einstieg. Verbessern Sie seine Genauigkeit und Ihren Handelserfolg erheblich, indem Sie Multi-Timeframe-Analyse (MTFA) einbeziehen, um vor dem Handeln auf Signale eine klare Richtungspräferenz zu etablieren.
Sein wahres Potenzial freisetzen:
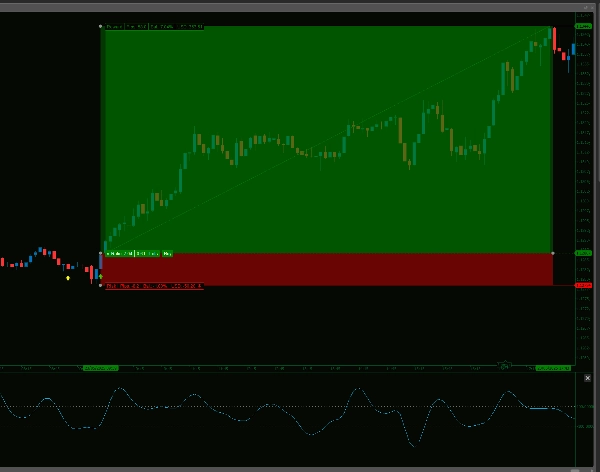
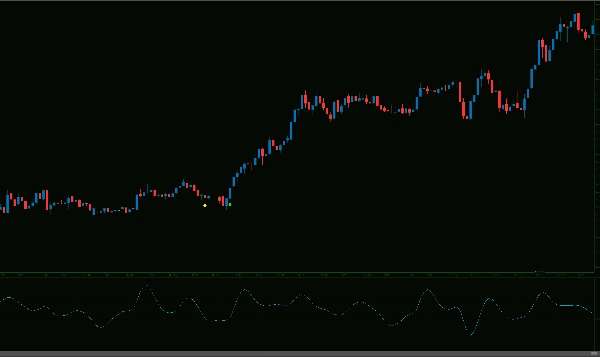
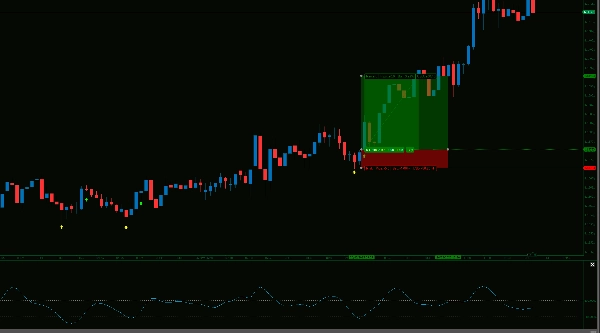
Die Kernstärke des Hull geglätteten CCI liegt in seiner Fähigkeit, Bereiche zu identifizieren, in denen der Markt überdehnt oder überkorrigiert ist und bereit ist, seinen vorherrschenden Trend fortzusetzen. Er hilft Ihnen, jene Momente zu erkennen, in denen das Gummiband bereit ist, zurückzuschnappen!
Zum Beispiel ist eine sehr effektive Strategie, darauf zu warten, dass der 5-Minuten-CCI unter -100 fällt und Ihre bullischen Alarmkriterien erfüllt. Suchen Sie dann nach Long-Chancen auf einem 1-Minuten-Chart genau dann, wenn eine Strukturunterbrechung in Richtung Ihrer etablierten höheren Zeitrahmen-Tendenz auftritt. Dieser methodische Ansatz kann erstaunliche Einstiegspunkte liefern.
Meistern Sie diese Konfluenzpunkte, und der Hull geglättete CCI wird zu einem unschätzbaren Werkzeug in Ihrem Trading-Toolkit!
Bitte beachten Sie, dass Alarme nur auf Windows-Geräten kompatibel sind.
--------------------------
Schauen Sie sich gerne auch meine anderen Indikatoren an!
https://ctrader.com/products/1181
https://ctrader.com/products/1182
https://ctrader.com/products/1180
https://ctrader.com/products/1015
https://ctrader.com/products/555
https://ctrader.com/products/553
https://ctrader.com/products/554
https://ctrader.com/products/552
https://ctrader.com/products/557
https://ctrader.com/products/845
https://ctrader.com/products/848
https://ctrader.com/products/847
https://ctrader.com/products/846
https://ctrader.com/products/551
https://ctrader.com/products/574
https://ctrader.com/products/573
https://ctrader.com/products/556
https://ctrader.com/products/558
https://ctrader.com/products/559
https://ctrader.com/products/560
Zusammenfassung
Kundenbewertungen
5 | 100 % | |
4 | 0 % | |
3 | 0 % | |
2 | 0 % | |
1 | 0 % |


