
Açıklama
🌐 Piyasa Yapısı Değişimi – Profesyonel Piyasa Yapısı Osilatörü
Gerçek Trend Yönünü Belirleyin. Gürültüyü Filtreleyin. Güvenle İşlem Yapın.
Piyasa Yapısı Değişimi, tüm piyasa koşullarında netlik, doğruluk ve güvenilirlik isteyen traderlar için geliştirilmiş yeni nesil yapısal bir trend osilatörüdür.
Gecikmeli hareketli ortalamalara veya volatilite tabanlı araçlara güvenmek yerine, bu gösterge fiyat davranışının özüne odaklanır: swing yüksekleri ve swing düşükleri.
Sonuç, size anında şunları tanımlamanıza yardımcı olan temiz, yüksek duyarlılığa sahip bir trend modelidir:
- Gerçek piyasa eğilimi
- Yapı geçişleri
- Trend devam gücü
- Gizli momentum değişimleri
İster swing trade yapın, ister günlük işlem yapın ya da algoritmik sistemler kullanın, Piyasa Yapısı Değişimi profesyonel düzeyde yapısal bir çerçeveyi doğrudan grafiğinize getirir.
🔥 Piyasa Yapısı Neden Önemlidir
Çoğu gösterge fiyatı hareket ettikten sonra analiz eder.
Piyasa yapısı farklı çalışır — trend gelişiminin temelini ölçer:
- Daha Yüksek Yüksekler / Daha Yüksek Düşükler → Boğa yapısı
- Daha Düşük Yüksekler / Daha Düşük Düşükler → Ayı yapısı
Bu, sadece fiyatın anlık hareketlerini değil, piyasanın hangi yöne doğru yapılandığını ortaya koyar.
Piyasa Yapısı Değişimi bu tüm süreci otomatikleştirir ve okunması kolay bir osilatöre dönüştürür.
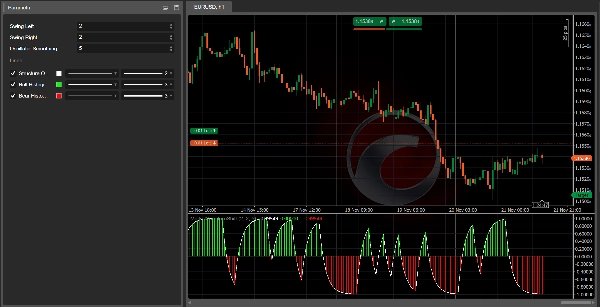
📊 Gösterge Ne Gösterir
✔ 1. Yapı Osilatör Çizgisi (Beyaz)
Dominant yapıyı net gösteren, EMA tabanlı yumuşatılmış bir trend çizgisi:
- 0'ın üzerinde → Boğa yapısı
- 0'ın altında → Ayı yapısı
- 0'a yakın → Yapı kararsızlığı veya trend geçişi
Bir bakışta piyasanın gerçek durumu ortaya çıkar.
✔ 2. Boğa Histogramı (Yeşil)
Boğa yapısı içindeki güç ve momentumu gösterir.
Daha güçlü çubuklar = daha güçlü yukarı yönlü baskı.
Uzun pozisyon kurulumlarını onaylamak için mükemmeldir.
✔ 3. Ayı Histogramı (Kırmızı)
Ayı yapısının momentumu ve gücünü gösterir.
Daha güçlü çubuklar = daha güçlü aşağı yönlü trend.
Kısa fırsatları doğrulamak için idealdir.
🎯 Traderlar Nasıl Kullanır (Profesyonel İş Akışı)
A. Trend Onay Filtresi
Yalnızca yapısal momentum yönünde işlem yapın:
- Osilatör 0'ın üzerindeyken uzun işlemler
- Osilatör 0'ın altındayken kısa işlemler
Bu basit kural birçok yanlış kurulumu ortadan kaldırır.
B. Yapısal Tersine Dönüş Tespiti
Osilatör sıfır çizgisini geçtiğinde büyük geçişler görünür:
- Kırmızı → Yeşil = Yeni boğa yapısı
- Yeşil → Kırmızı = Yeni ayı yapısı
Bu, geleneksel araçların tepki vermesinden çok önce trend değişimlerine erken bir bakış sunar.
C. Çoklu Zaman Dilimi Optimizasyonu
Gösterge MTF iş akışlarında olağanüstü güçlüdür:
- Trend çerçevesi için H4/H1 kullanın
- Girişler için M30/M15 kullanın
Karşı trend işlemlerini önleyin ve doğruluğu maksimize edin.
D. Piyasa Yapısı Sinyalleri ile Sinerji
Piyasa Yapısı Değişimi, Piyasa Yapısı Sinyalleri ile birleştiğinde tam bir işlem sistemi haline gelir ve şunları sağlar:
- ALIŞ/SATIŞ okları
- Görsel değişim işaretçileri
- Yapısal kırılma uyarıları
Birlikte, tam kapsamlı yukarıdan aşağıya yapı tabanlı bir metodoloji oluştururlar.
⚙️ Tüm Piyasalar İçin Tasarlandı
✔ Forex
✔ Endeksler
✔ Kripto
✔ Metaller
✔ Sentetik piyasalar
✔ Vadeli işlemler (CFD vekilleri aracılığıyla)
Parametre kontrolü sayesinde yüksek uyarlanabilirlik:
- Swing tespiti
- Yumuşatma gücü
- Yapısal değişikliklere duyarlılık
📈 Önerilen Ayarlar
- Swing Sol/Sağ: Forex ve Endeksler için 2–3, Kripto için 3–3
- Osilatör Yumuşatma: Dengeli tepki için 5–8
Kutudan çıktığı gibi çalışacak şekilde tasarlanmıştır, ancak tamamen özelleştirilebilir.
💬 Ücretsiz Araçlar ve Optimizasyonlar İçin Topluluğumuza Katılın
Profilimdeki bağlantıya tıklayarak işlem topluluğumuza katılabilirsiniz, burada bulacaksınız:
- Optimum parametre setleri
- Ekstra araçlar
- Yapı tabanlı stratejiler
- AlgoTrend göstergeleri için özel kaynaklar
Sisteminizi geliştirmek ve tutarlılığı artırmak için harika bir alan.
Özet
Traders use Market Structure Shift for trend confirmation by trading only in the direction of structural momentum, detecting structural reversals via zero-line crossings, and optimizing multi-timeframe workflows (e.g., H4/H1 for trend framework, M30/M15 for entries). It integrates with Market Structure Signals to provide buy/sell arrows, visual shift markers, and structural break alerts, forming a comprehensive structure-based trading system.
The indicator supports multiple markets including Forex, indices, cryptocurrencies, metals, synthetic markets, and futures (via CFDs). It offers customizable parameters for swing detection, smoothing, and sensitivity to structural changes, enabling adaptability across different asset classes and trading styles.
Müşteri değerlendirmeleri
5 | 0 % | |
4 | 100 % | |
3 | 0 % | |
2 | 0 % | |
1 | 0 % |


