
Supertrend - Multi-Timeframe
Chỉ báo
1 lượt mua
Phiên bản 1.0, Oct 2025
Windows, Mac
4.5
Đánh giá: 2
Mô tả
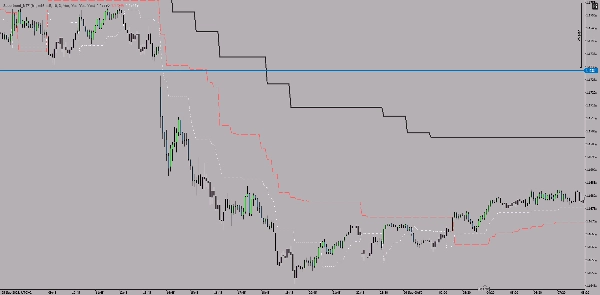
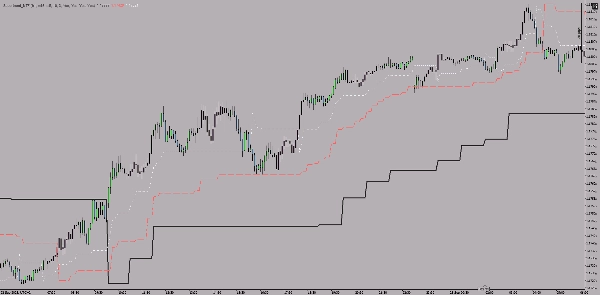
Đây là chỉ báo Supertrend đa khung thời gian cho nền tảng cTrader hiển thị các đường Supertrend từ ba khung thời gian khác nhau cùng lúc trên một biểu đồ duy nhất.
Tính Năng Chính
Hiển Thị Ba Khung Thời Gian Song Song:
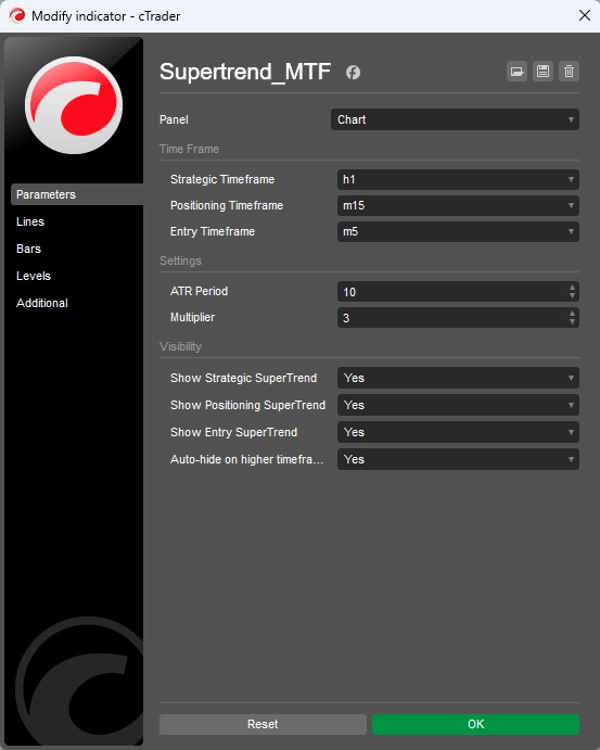
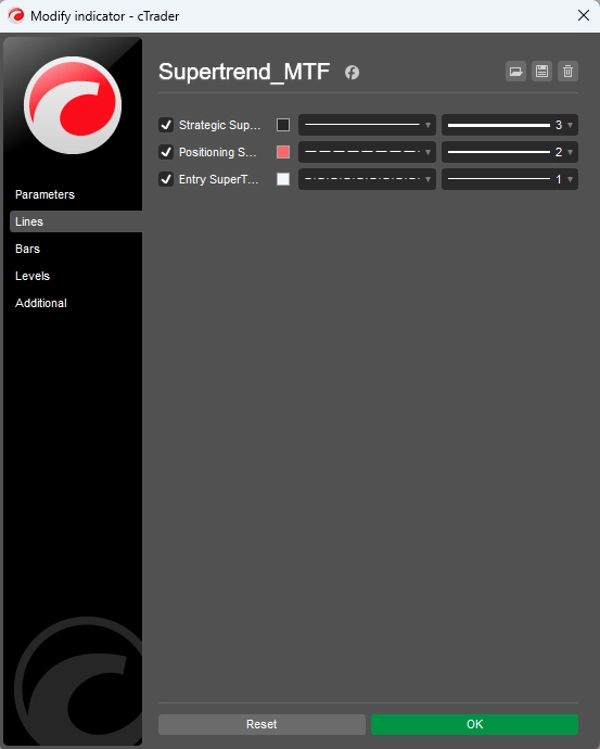
- Khung thời gian chiến lược (mặc định: 1 giờ) - đường dày, liền nét
- Khung thời gian định vị (mặc định: 15 phút) - độ dày trung bình, đường nét đứt
- Khung thời gian vào lệnh (mặc định: 5 phút) - đường mỏng, chấm chấm
Cài Đặt Tùy Chỉnh:
- Chu kỳ ATR (mặc định: 10)
- Hệ số nhân (mặc định: 3.0)
- Mỗi trong ba khung thời gian có thể được bật/tắt riêng biệt
- Tự động ẩn trên các khung thời gian cao hơn (tùy chọn)
Cách Hoạt Động
Chỉ báo sử dụng logic Supertrend cổ điển cho cả ba khung thời gian, trong đó:
- Xu hướng tăng khi giá nằm trên đường Supertrend
- Xu hướng giảm khi giá nằm dưới đường Supertrend
- Độ dày và kiểu đường khác nhau giúp phân biệt các khung thời gian
Mục Đích
Hỗ trợ phân tích đa khung thời gian: khung thời gian lớn hơn cung cấp hướng chính (chiến lược), khung giữa tinh chỉnh vị trí, và khung nhỏ nhất đánh dấu các điểm vào lệnh cụ thể.
Tóm tắt
Tóm tắt AI
The Supertrend - Multi-Timeframe Indicator for the cTrader platform displays Supertrend lines from three distinct timeframes simultaneously on a single chart. It features a strategic timeframe (default 1 hour) shown as a thick solid line, a positioning timeframe (default 15 minutes) as a medium dashed line, and an entry timeframe (default 5 minutes) as a thin dotted line. Each timeframe can be individually enabled or disabled, with customizable settings including ATR period and multiplier. The indicator applies classic Supertrend logic: the trend is considered up when the price is above the Supertrend line and down when below. Different line styles and thicknesses visually distinguish the timeframes. This tool supports multi-timeframe analysis by providing the main directional trend from the larger timeframe, refined positioning from the middle timeframe, and specific entry points from the smallest timeframe. It is applicable across various markets including Forex, indices, commodities, stocks, and cryptocurrencies, and supports symbols such as BTCUSD, EURUSD, GBPUSD, XAUUSD, NAS100, and USDJPY.
Hồ sơ chỉ báo
Đánh giá của khách hàng
4.5
Đánh giá: 2
5 | 50 % | |
4 | 50 % | |
3 | 0 % | |
2 | 0 % | |
1 | 0 % |
Đánh giá của khách hàng
October 13, 2025
The part worth keeping is the setup needs a cleaner reason to exist, and a few ugly trades are useful in the sample.
October 10, 2025
Thảo luận
Câu hỏi thường gặp
BTCUSD
Forex
Breakout
Indices
EURUSD
Commodities
GBPUSD
NZDUSD
Prop
Scalping
Crypto
Stocks
XAUUSD
NAS100
USDJPY
Các sản phẩm có sẵn trên cTrader Store, bao gồm bot giao dịch, chỉ báo và plugin, được cung cấp bởi các nhà phát triển bên thứ ba và chỉ nhằm mục đích cung cấp thông tin và tiếp cận kỹ thuật. cTrader Store không phải là nhà môi giới và không cung cấp lời khuyên đầu tư, khuyến nghị cá nhân hay bất kỳ đảm bảo nào về hiệu suất trong tương lai.


Giá
Kể từ 05/01/2025
14
Lượt bán